


DATA VISUALIZATION SOFTWARE
Create Clarity from Complexity with Qlik's Data Visualization Software
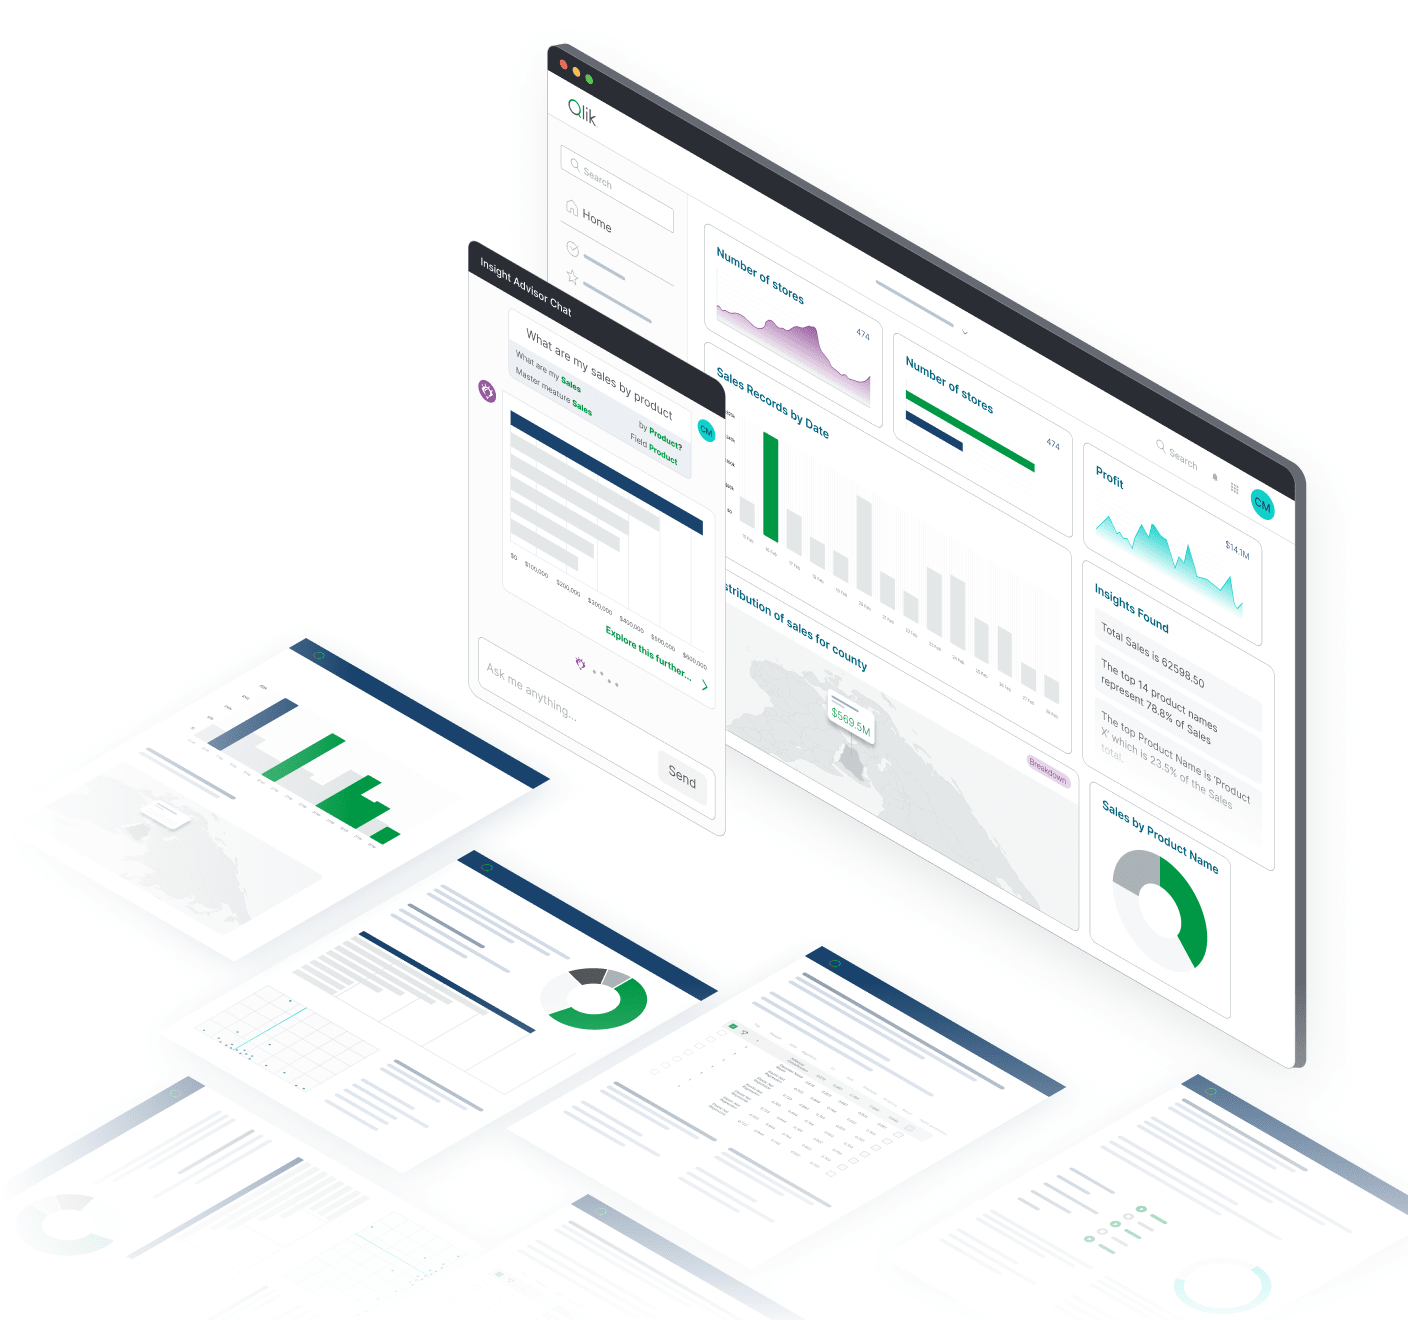
Create interactive dashboards, visual analytics, and real-time insights that transform complex data into clear, actionable intelligence for faster, smarter decision-making across your organization.
Turn raw data into actionable insights with interactive visualizations
Empower every team member to discover insights and make data-driven decisions through intuitive, powerful visualization capabilities.
Empower teams with intuitive, role-based dashboards
Enable business users to create and customize interactive dashboards with drag-and-drop simplicity while maintaining enterprise governance and security.
Identify trends and outliers with real-time visual analytics
Discover patterns, anomalies, and opportunities instantly with associative visual exploration that reveals hidden relationships in your data.
Improve decision-making with contextual data storytelling
Transform data into compelling narratives that communicate insights effectively across all organizational levels and business contexts.
How does Qlik's data visualization platform work?
Step 1 - Connect to all your data sources with ease using 500+ pre-built connectors and real-time integration capabilities
Step 2 - Clean and shape data for visual exploration with automated preparation and intelligent transformation
Step 3 - Build dashboards with drag-and-drop simplicity using intuitive interfaces and smart visualization suggestions

Why choose Qlik for data visualization?
Enterprise-grade visualization capabilities designed for modern business requirements

Centralized governance and data lineage for trustworthy insights
Ensure data accuracy and consistency across all visualizations with comprehensive governance frameworks and complete data lineage tracking.

Flexible deployment across departments, devices, and clouds
Deploy visualization capabilities across any infrastructure with cloud, on-premises, and hybrid options that scale with your organization.

AI-assisted visualizations and natural language search
Accelerate insight discovery with AI-powered visualization suggestions and natural language capabilities that democratize data exploration.

Designed for business users and data analysts
Provide appropriate visualization tools for both self-service business users and advanced analysts without compromising functionality or ease of use.
Proven impact across industries and use cases
Join organizations that have transformed their decision-making processes through effective data visualization and insight communication.
Key capabilities of Qlik's data visualization software
Comprehensive visualization capabilities for enterprise requirements
Interactive dashboards with real-time data refresh
Create dynamic dashboards that update automatically as new data arrives, ensuring users always have access to current information.
Smart visual suggestions powered by AI
Leverage artificial intelligence to automatically suggest optimal chart types, identify patterns, and recommend visualizations based on your data.
Natural language interaction and search-driven insights
Enable users to ask questions in plain English and receive instant visual answers through conversational analytics capabilities.
Custom charts, graphs, and visual components
Build sophisticated visualizations with extensive customization options, advanced chart types, and reusable visual components.
Self-service reporting and team collaboration
Empower users to create reports independently while enabling collaborative analysis and insight sharing across teams.
Enterprise-grade security and governance
Maintain comprehensive security controls and governance frameworks that protect sensitive data while enabling self-service visualization.
Trusted by leading enterprises worldwide
What our customers say
We started an automation process with Qlik and now we only have half the people managing reports. The other half is doing activities allowing us to leapfrog the competition by providing even more proactive analytics vs. reactive.
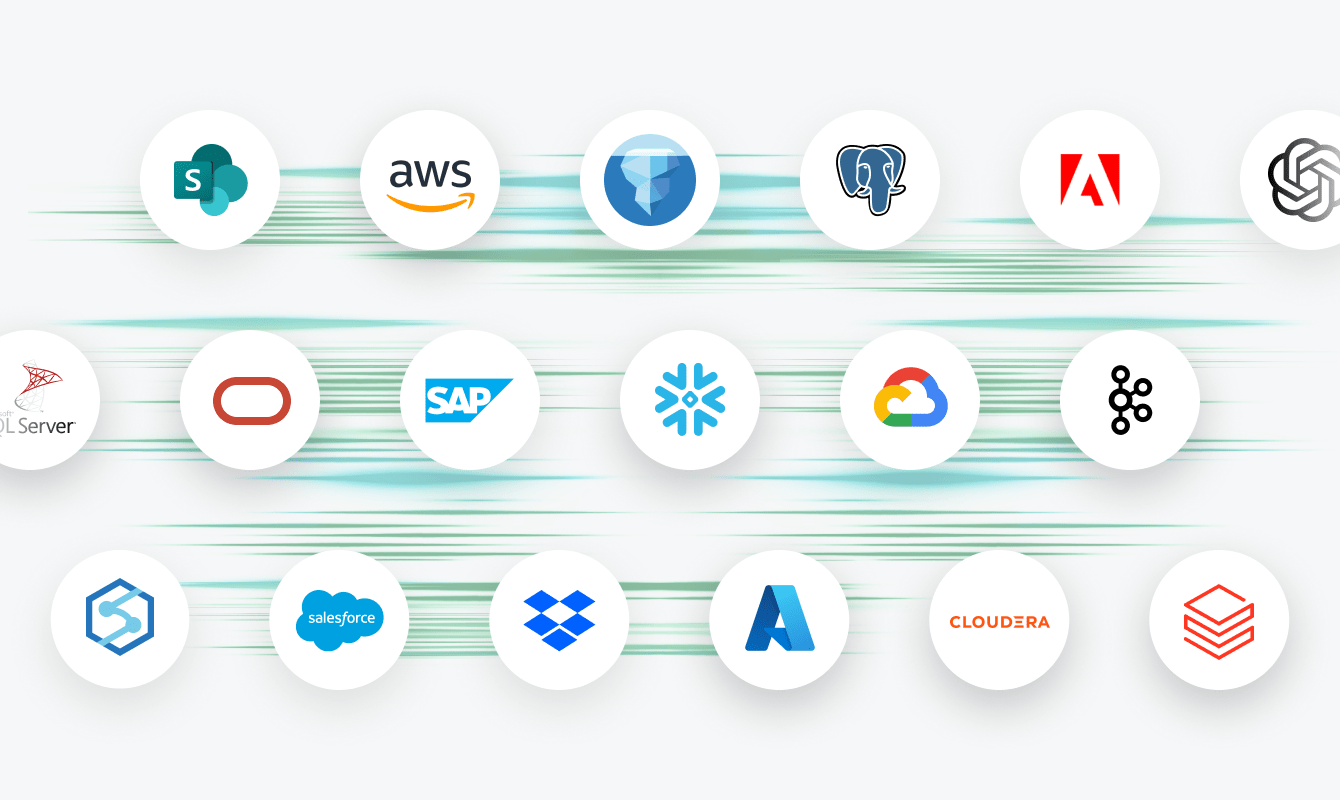
Connect to 500+ data sources with Qlik’s analytics integrations
SAP
Adobe
IBM

AWS

MySQL

Jira

Azure
MS SQL

Apache

Mongo DB
SAP
Adobe
IBM
AWS
MySQL
Jira
Azure
MS SQL
Apache
Mongo DB
SAP
Adobe
IBM
AWS
MySQL
Jira
Azure
MS SQL
Apache
Mongo DB
SAP
Adobe
IBM
AWS
MySQL
Jira
Azure
MS SQL
Apache
Mongo DB
SAP
Adobe
IBM
AWS
MySQL
Jira
Azure
MS SQL
Apache
Mongo DB
Oracle
Salesforce
Workday
Apache Iceberg

CircleCI

Zendesk

Snowflake

Databricks


OpenAI
Intuit
Oracle
Salesforce
Workday
Apache Iceberg
CircleCI
Zendesk
Snowflake
Databricks
OpenAI
Intuit
Oracle
Salesforce
Workday
Apache Iceberg
CircleCI
Zendesk
Snowflake
Databricks
OpenAI
Intuit
Oracle
Salesforce
Workday
Apache Iceberg
CircleCI
Zendesk
Snowflake
Databricks
OpenAI
Intuit
Oracle
Salesforce
Workday
Apache Iceberg
CircleCI
Zendesk
Snowflake
Databricks
OpenAI
Intuit
Resources to help you succeed with data visualization


Data visualization software FAQs
Our platform includes extensive visualization options from basic charts and graphs to advanced geospatial visualizations, custom visual components, and interactive dashboards tailored to specific industry needs.
We employ intelligent data sampling, in-memory processing, and associative analytics that enable interactive visualization of large datasets without performance degradation.
Yes, our platform is designed for business users with drag-and-drop interfaces, AI-powered suggestions, and guided visualization creation that requires no technical expertise.
We implement role-based access controls, data encryption, and comprehensive governance frameworks that ensure users only see data they're authorized to access while maintaining collaboration capabilities.