QLIK ENTERPRISE MANAGER®
Manage Your Data Pipelines Centrally, at Scale


Get a command center to configure, execute, and monitor replication and transformation across the enterprise.
KEY RESOURCE
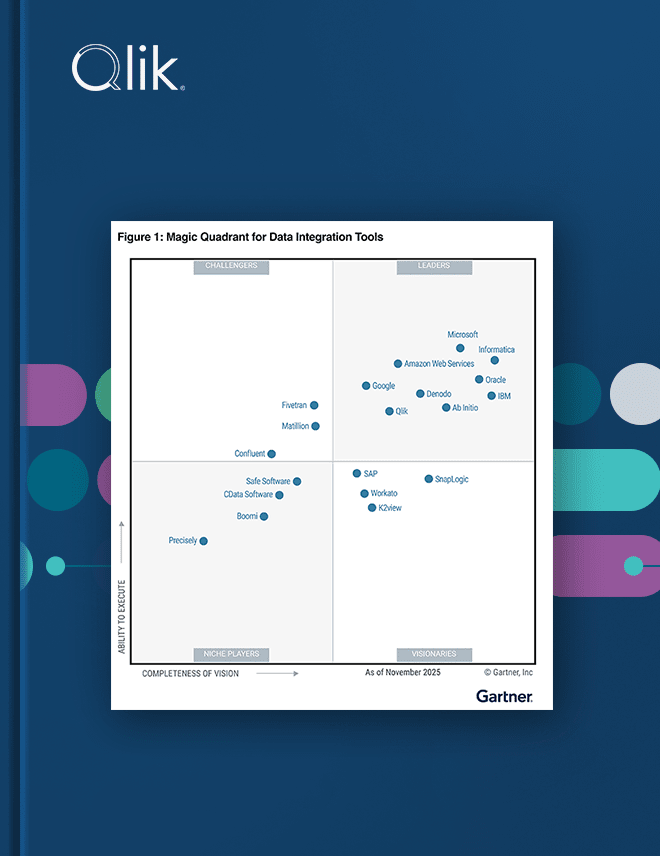
2025 Gartner® Magic Quadrant™ for Data Integration Tools
For the 10th consecutive year, Qlik was recognized as a Leader in the 2025 Gartner® Magic Quadrant™ for Data Integration Tools. Learn why in this complimentary report.

Rapidly, efficiently integrate data and metadata for analytics, at scale, across heterogeneous environments
Design, execute, and monitor Qlik Replicate® and Qlik Compose® tasks across large business landscapes, all from a graphical user interface.

Simplify management with an enterprise wide replication console
Design and execute batch loads and continuous change data capture (CDC) across a wide range of supported sources and targets through a single pane of glass.
Enable massive management consolidation across dozens of Qlik Replicate servers and hundreds if not thousands of heterogeneous endpoints.

Monitor, analyze, and control your data
Concurrently monitor hundreds of replication tasks in real time across your environment
View real-time dashboards with performance KPIs and historical charts to augment capacity planning and load-balancing decisions
Automate design and operation of replication tasks, and integrate with enterprise dashboards via APIs
Supported APIs: REST, .NET, and Python

Integrate your data streams with Qlik Catalog®
Automatically catalog data assets generated by Qlik Replicate directly in Qlik Catalog
Track end-to-end data lineage to improve compliance, governance, and trust in Qlik Catalog

DataOps for analytics with
Qlik’s smart enterprise data platform
Get real time, analytics-ready, and actionable data to an analytics environment, from Qlik to Tableau, Power BI and beyond.


Frequently Asked Questions (FAQs)
A single pane of glass is a unified management interface that brings information and controls from many different systems together into one consolidated view. Instead of logging into separate tools to manage each component, administrators can monitor and operate everything from one screen. In data integration, it lets teams design, run, and monitor many pipelines across numerous servers and endpoints from a central console.
Data pipeline monitoring is the ongoing tracking of data pipelines to ensure they run correctly, on time, and without errors. It watches things like task status, throughput, latency, and failures, and alerts teams when something goes wrong so issues can be fixed before they affect downstream users. At scale — across hundreds or thousands of pipelines — centralized monitoring is essential to keep data flowing reliably and meet service commitments.
Data observability is the practice of continuously understanding the health and reliability of data and data pipelines across a system. It goes beyond basic monitoring to give visibility into data freshness, volume, quality, schema changes, and lineage, helping teams detect and diagnose problems quickly. The goal is to catch issues — like a pipeline silently breaking or values drifting — before they reach reports, models, or decisions.
DataOps is a set of practices that applies agile and DevOps principles to data, aiming to deliver reliable, high-quality data quickly and continuously. It emphasizes automation, collaboration between data teams, monitoring, and repeatable processes across the whole data lifecycle. The goal is to make data pipelines faster to build, easier to change, and more dependable in production.
A data service-level agreement (SLA) is a defined commitment about the delivery and quality of data — for example, how fresh it will be, how quickly it will arrive, or how available a pipeline must be. It sets clear expectations between data providers and the teams that depend on the data, and gives a measurable standard to monitor against. Meeting data SLAs is a key reason organizations closely track pipeline performance.
In data integration, an endpoint is a source or target that a pipeline connects to — such as a database, application, file system, cloud service, or streaming platform. Source endpoints are where data is read from, and target endpoints are where it's delivered. Defining endpoints is a foundational step in building a pipeline, since it establishes where data will move from and to.
Data pipeline management is the practice of designing, deploying, running, and maintaining data pipelines across their lifecycle — often many at once. It covers configuring tasks, scheduling and executing them, monitoring their health, and resolving issues, ideally from a central place. Good pipeline management keeps data delivery reliable and efficient as the number and complexity of pipelines grow.
Data replication is the process of continuously copying data from a source system to one or more target systems so the copies stay in sync as the source changes. It's widely used to offload analytics and reporting from busy production databases, keep systems highly available, and feed cloud warehouses and lakes. Efficient replication moves only what changed rather than reloading everything, keeping targets current with minimal overhead.
Change data capture (CDC) is a method that detects the inserts, updates, and deletes happening in a source system and passes just those changes to downstream targets in near real time. By moving only what changed, it keeps targets continuously up to date without the cost of repeatedly reloading full datasets. Reading changes from the database's transaction log is the preferred approach because it captures every change with minimal impact on the source, making it well suited to running many pipelines at scale.
Data lineage traces how data moves and transforms across systems — from its original sources, through each processing step, to where it's ultimately used. Consolidating this view across many pipelines gives organizations the transparency needed for compliance, auditing, and trust. It also makes troubleshooting easier, since teams can quickly see the origin of a value or the downstream impact of a change.
A full load copies an entire dataset from source to target in one pass, establishing a complete baseline, while change data capture (CDC) then keeps that target current by moving only subsequent changes. The two normally work together: the full load runs once to populate the target, and CDC takes over to apply ongoing inserts, updates, and deletes. This combination avoids the heavy cost of repeatedly reloading everything while keeping data continuously synchronized.


