Talend® Data Fabric

Get more value from your data with complete, flexible, trusted data management.

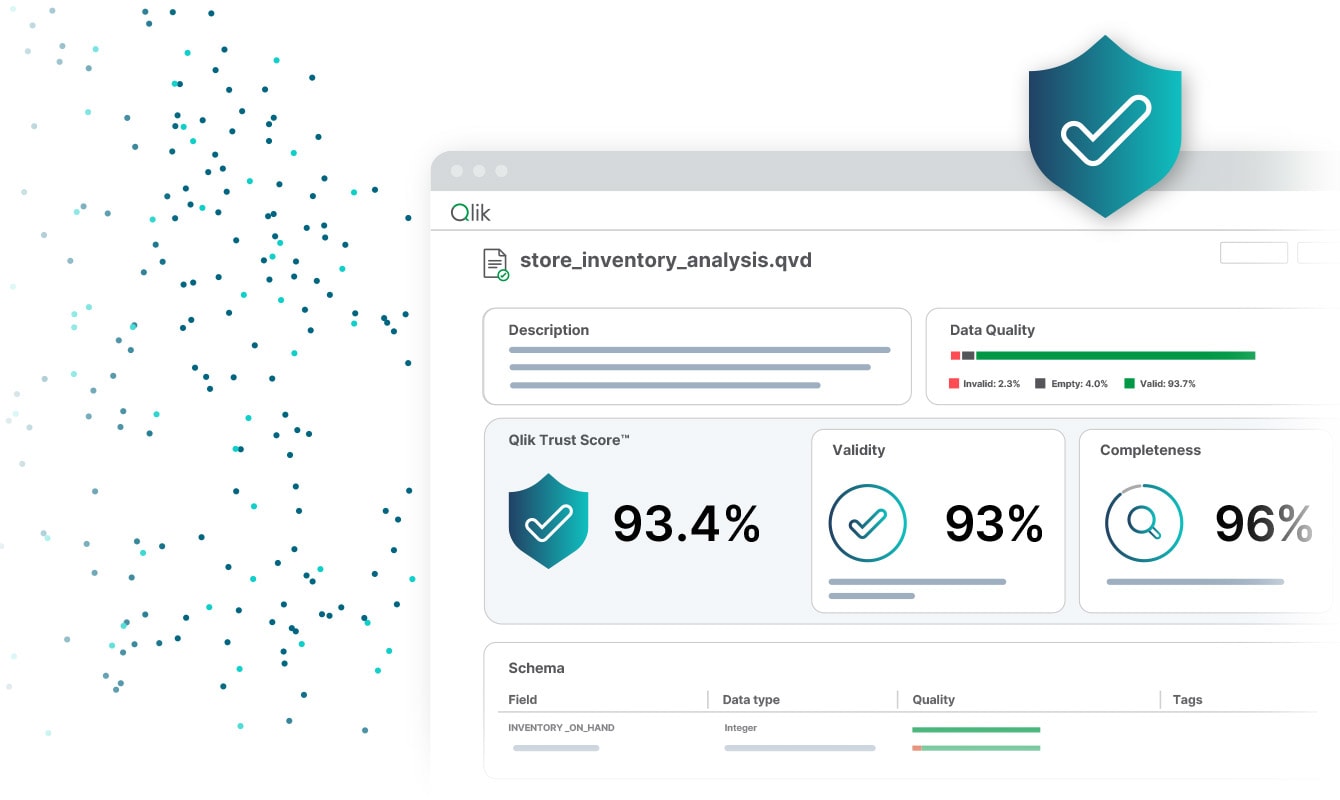
Composite of Talend interface screens showcasing data inventory, data quality measures, and workflow management, with charts, tables, and diagrams on multiple overlapping windows.

Make the right decisions

Achieve and maintain the complete, trustworthy, and uncompromised data you need to stay in control, mitigate risk, and drive value. Maintain that careful balance between availability, usability, integrity, and security.

Click to play "Talend - Trust Starts Here" video via YouTube.

Make every decision with confidence

Bring data integration, integrity, and governance together in a single modular platform, supported by a strong partner ecosystem and services infrastructure.

Diagram of Talend Data Fabric depicting three core elements: data integration, data quality and governance, and application and API integration, with Talend Trust Score as a central component..

Easily launch data driven initiatives

Here’s how to make a difference in your business:

Icon representing loyalty.

Build customer loyalty and enthusiasm

Icon of a coin

Improve operational efficiency and save money

Icon of a warning sign

Reduce risk and ensure regulatory compliance

Icon representing DataOps

Modernize IT infrastructure and optimize costs

You don’t have to take our word for it:

Customer experience multiplied take up rate by 5x through more customized product offerings.

PT Bank Danamon company logo
Skyscrapers with glass facades reflecting neighboring buildings under a cloudy sky in a metropolitan financial district.
PT Bank Danamon company logo

Financial services

Customer experience multiplied take up rate by 5x through more customized product offerings.

Energy and utilities

Operational efficiency powered the entire organization with data at 10x the speed for 1/10 the cost.

Customer intelligence

Customer intelligence turned real-time analytics into 11% revenue growth.

Food services

Customer unified 85,000 data sources to enhance customer engagement and business operations.

Food and beverage

Supply chain optimization used real-time IoT data to optimize product storage, transportation, and delivery.

1 of 5

Raise your expectations for data management

Icon representing completed

Complete

Implement a modular solution that supports the entire data lifecycle and users across the organization.

Icon representing flexibility

Flexible

Activate a scalable and extensible, cloud-independent solution that supports a variety of deployment architectures.

Icon of a shield

Trusted

Count on a proven solution that delivers transparent value while supporting security and compliance needs.

Gartner® Magic Quadrant™ for Data Integration Tools 4-quadrant graph showing Qlik in the leader quadrant

2024 Gartner® Magic Quadrant™ for Data Integration Tools

See why Qlik® is a Leader in the Gartner Magic Quadrant for Data Integration Tools.

Talend Data Fabric
Resources

Solve your data challenges