Qlik Product Strategy and Roadmap
Explore how Qlik is advancing our capabilities to help organizations make their data work for AI.

Qlik’s strategic vision
We're all about helping you deliver trusted, contextual, and interoperable data with ways to control cost at speed, so your data works wherever and however you use it.
Agentic AI

Enable interoperable, multi-agent collaboration that connects analytics, insights, and action across environments.
Embed trusted, governed data intelligence into every agent, including third-party agents through standards like MCP.
Deliver intelligent, adaptive reasoning across governed structured and unstructured data, leveraging our analytics engine to move beyond simple responses.
Data as foundation for AI

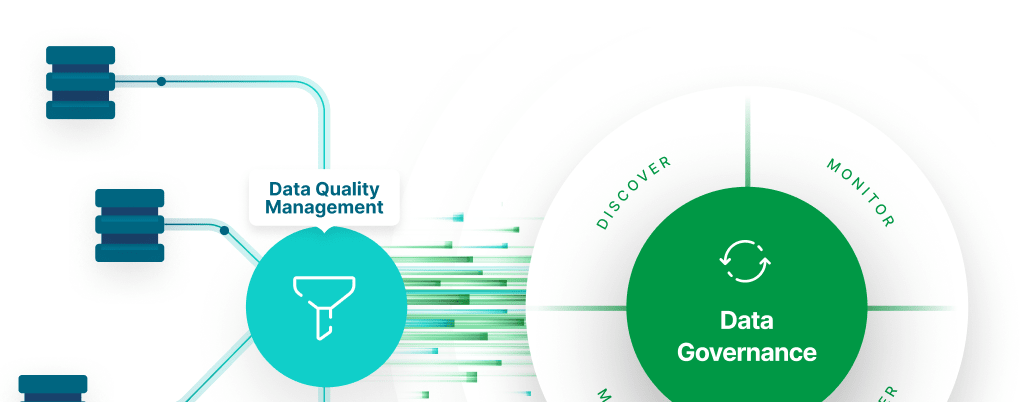
Build trusted, AI-ready data from any source with governed real-time pipelines, establishing reliability before insights.
Deliver continuous data quality and trust scores through unified governance monitoring and compliance.
Support flexible AI pipelines optimized for LLMs and analytics workloads.
Context-Aware intelligence
Drive business outcomes through natural language answers from structured and unstructured data.
Combine governed contextually-aware analytics with AI reasoning for more accurate and relevant intelligence.
Close the gap between analysis and impact with automation and seamless execution.
Learn more about Qlik Analytics® Engine


Qlik Insider: 2026 Product Roadmap Webinars
In these special Qlik Insider webinars, we share a first look at Qlik’s 2026 product roadmaps, highlighting the strategic direction guiding our innovation across analytics and data integration.
Qlik's Roadmap
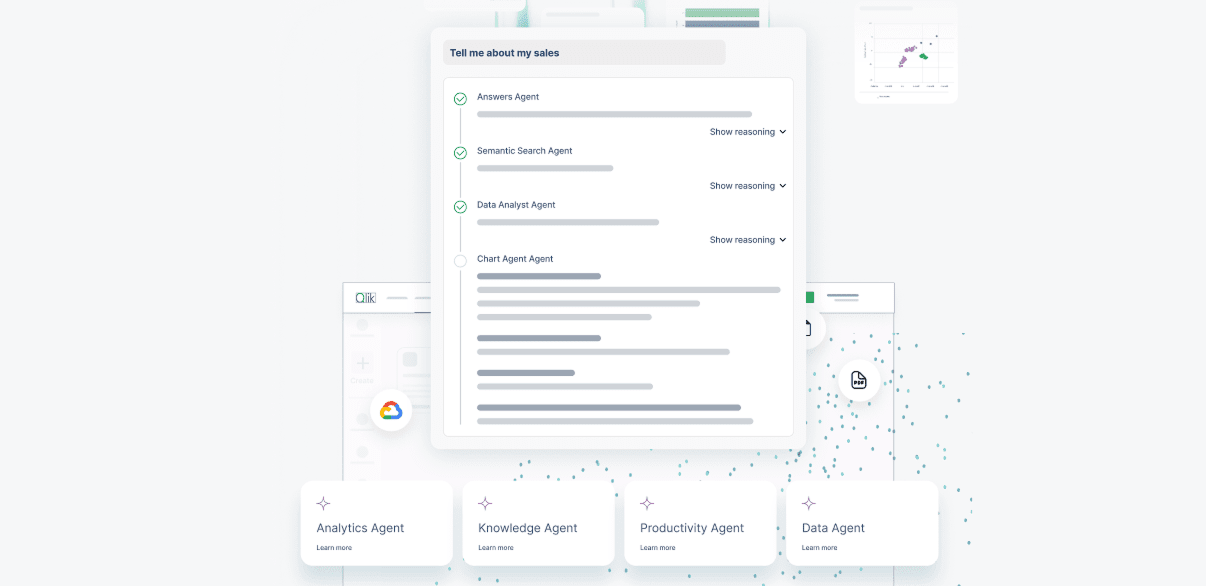
Agentic AI + MCP
Enable our customers with a collection of agents designed for specific data integration, analytics, and automation tasks. These agents can work individually or collectively to make decisions and take action. Additionally, we will empower our customers to directly engage with AI ecosystems using MCP.

Provide trusted and high-quality data
Enrich our Data Products capabilities to serve as a connective layer across Qlik’s ecosystem, ensuring that every experience, whether creating a sheet, running a prediction, building an automation, or accessing Qlik data through an API, can leverage timely, high-quality data.
Lakehouse adoption
Broaden the scope of Qlik Open Lakehouse to support streaming, hybrid architectures, transformations, and additional cloud storage providers.

Data & AI sovereignty
Empower data sovereignty. Expand the number of cloud regions around the world to support data residency, lower latency, and governed AI.

Have an idea for a new capability? Suggest it now with Qlik Ideation
What's New - Product Recaps
June marks one of Qlik's most significant releases to date, extending our vision for agentic experiences across both data engineering and analytics. From trusted data products and AI-assisted data engineering to predictive intelligence, automated actions, and advanced reasoning capabilities, these innovations help organizations move beyond understanding what happened to predicting, deciding, and acting with confidence.

March brings MCP-powered Agentic AI, fully integrated Data Products, and Data Quality built right into analytics workflows. The result: trusted, governed analytics from data to decision.

Discover our Qlik Product Recap, your guide to the latest innovations available to you! Explore the latest features and improvements designed to unlock more value and elevate your experience. Dive in to see what’s new, what’s possible, and how to make the most of it.