


SEE CRITICAL CHANGES AS SOON AS THEY HAPPEN
Discovery Agent Tracks What’s Changed
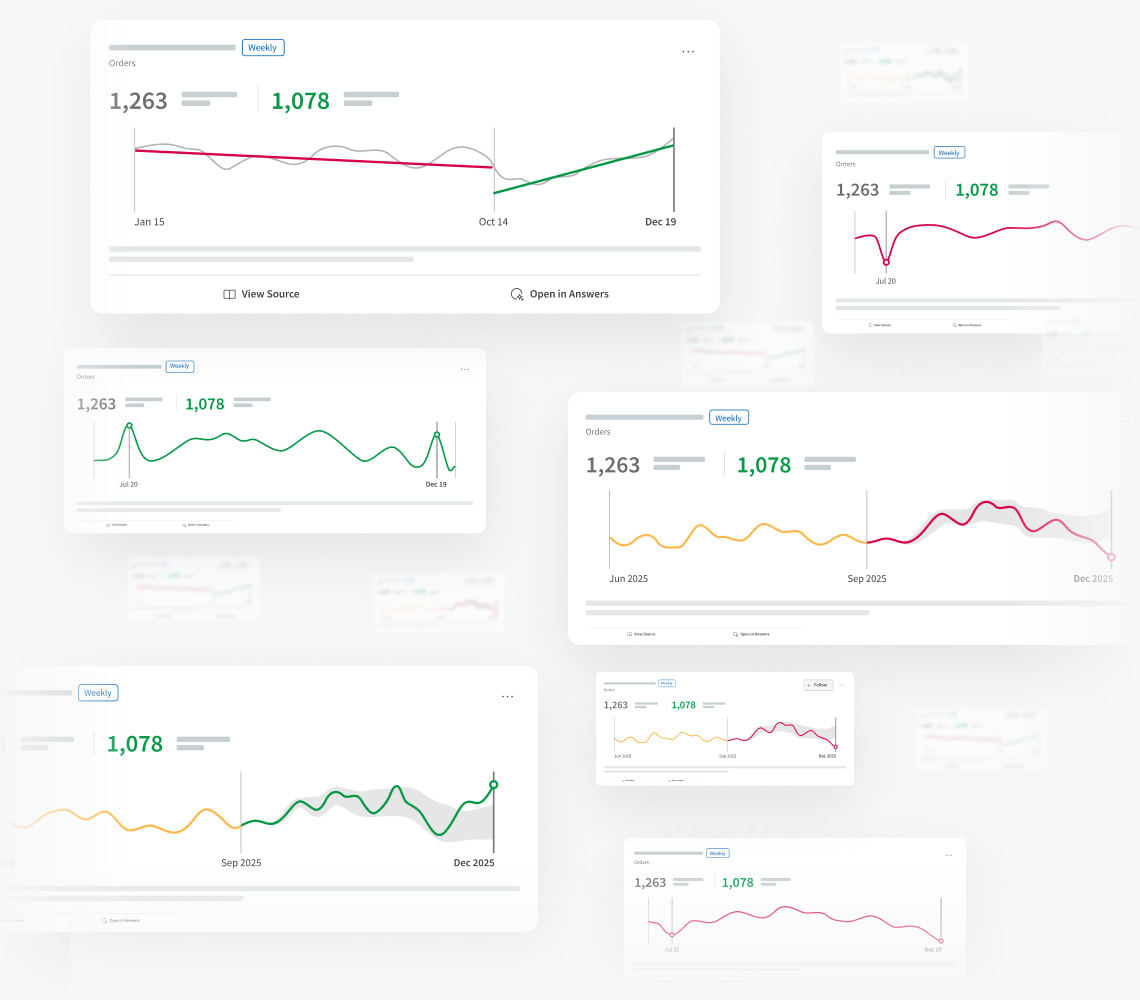
Discovery Agent is Qlik’s AI-driven anomaly and outlier detection agent that monitors your Qlik apps, detects meaningful shifts in your data, and delivers clear, prioritized insights so teams can act before issues escalate.
Dashboards require you to look for anomalies, Discovery Agent pushes them to you.
Dashboards lag. Alerts miss. You fall behind.
Critical changes go unnoticed until they’re costly
Gradual shifts and new baselines never trigger alerts
Analysts spend hours checking dashboards
SQL-based monitoring breaks under scale
You need a system that’s always on, watching the data, and deciding what truly matters.
Engine-powered anomaly detection at enterprise scale
Discovery Agent runs on the Qlik Analytics Engine, evaluating complex data without heavy SQL or query design. It can:
Analyze data using associative technology with high dimensionality
Run across large data sets without inflating compute costs
Consider full context instead of one metric at a time
It’s anomaly detection that’s both statistically smart and practical at scale.

Never miss an important signal again
Eliminate manual monitoring

Let AI do the heavy lifting
Replace manual KPI checks and SQL scripts with automated, engine-powered scanning.
Scale your monitoring
Watch everything without lifting a finger.
Enable anomaly detection across many apps.
Improve trust in your data
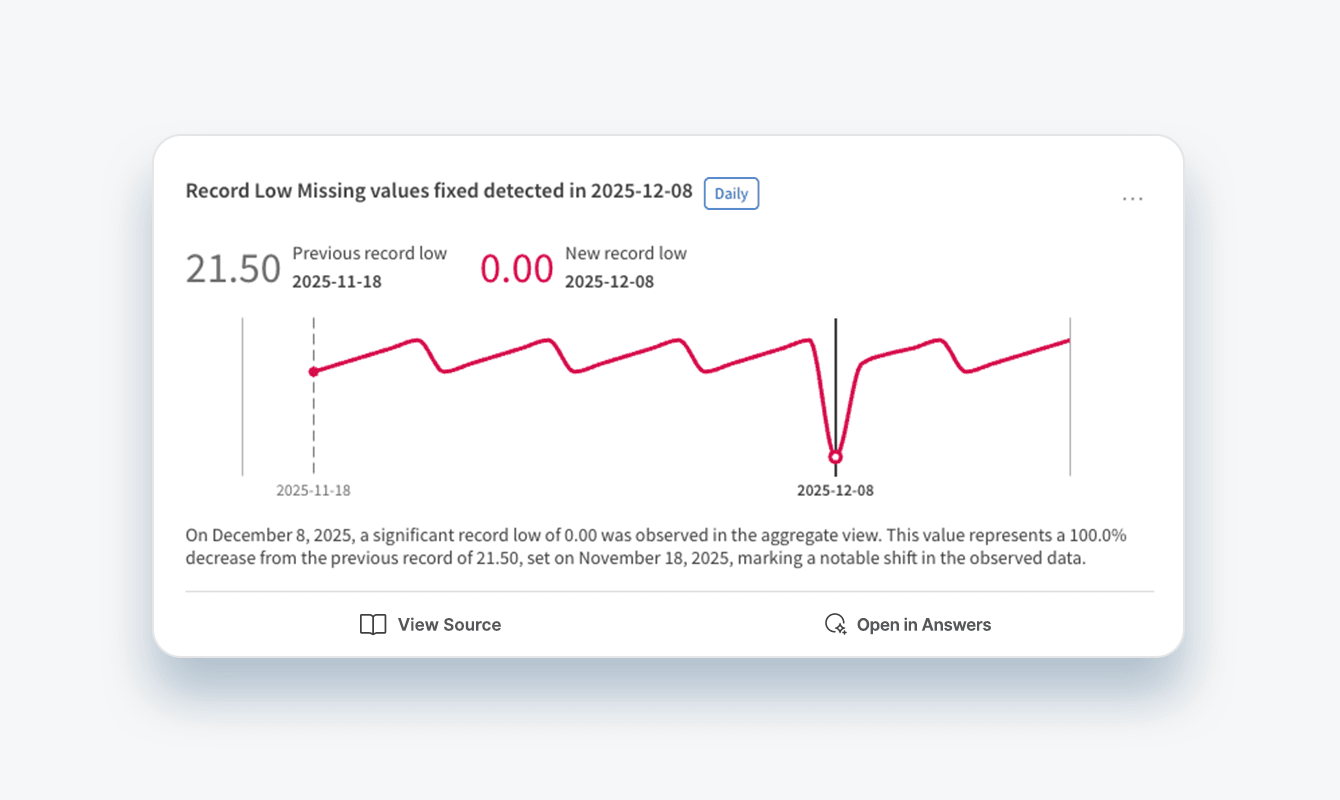
Spot bad data before it causes bad decisions
Automatically flag missing or inconsistent data, so decisions rest on solid ground.
Built for leaders and analysts who can’t afford surprises
Business leaders want to see what changed — no dashboards required. Analysts want less grunt work and more time for real analysis. Data leaders need scalable, reliable change detection without building custom monitoring logic or managing alert fatigue.
Keep an eye on:
Spikes in cancellations or returns, drops in service levels or delivery rates, or shifts in backlog or utilization.

Watch for:
Unexpected swings in revenue, margin, or cost centers. Look for cash flow or aging pattern deviations or outliers in pricing or expenses.

Automatically detect:
Changes in usage or engagement, new baselines for churn or support volume, and anomalies in key product flows.

Watch for:
Gaps in source data, shifts in value distributions or codes, and metrics behaving differently from the past.
Start seeing what’s changing as soon as it changes
Discover how Discovery Agent helps your teams stay ahead of risks and opportunities — without adding more dashboards or manual checks.