TALEND® DATA FABRIC – POWERED BY QLIK

Data integration and governance platform

Get more value from your data with complete, flexible, trusted data integration.

Databricks
Confluent
Azure
Oracle
AWS
Google Cloud
Snowflake
Apache Iceberg
Salesforce

SEE WHAT TALEND DATA FABRIC HAS TO OFFFER

Benefits of a modern data fabric approach

A digital dashboard on a screen showcasing website analytics and user interface elements, including Qlik TRUST SCORE. Blue and green dots are on the left, and green lines are on the right.

Build confidence with governed, high-quality data.

Comprehensive data quality tools help ensure your data is clean, and ready for decision-making.

Four interconnected icons representing security, risk management, compliance, and Qlik Talend Cloud, with a shield in the background.

Connect, transform, and govern all in one platform.

A unified solution that handles ingestion, transformation, cataloging, and compliance — on-premises or across any cloud environment.

Illustration showing the Qlik logo in the center, with blurred green-blue lines on the left and screen interfaces displaying analytical data or graphs on the right, implicating data in and data out.

Enable business and technical users alike.

Self-service tools, shared workflows, and automated pipelines make it easy for everyone to work with data securely and efficiently.

Why Talend Data Fabric leads the market

Gartner

For ten years, Gartner® has positioned Qlik® as a Leader in its Magic Quadrant™ for Data Integration Tools.

Get the Report Now

Gartner

See why Qlik was named a Leader in the 2026 Gartner® Magic Quadrant™ for Augmented Data Quality Solutions for the seventh time.

Illustration displaying Gartner Magic Quadrant™ for for Data Integration Tools and Augmented Data Quality Solutions, focusing and data integration and data quality.

Core components of an enterprise data fabric

Dive deeper into the tools that power trusted, governed, and agile data across your business.
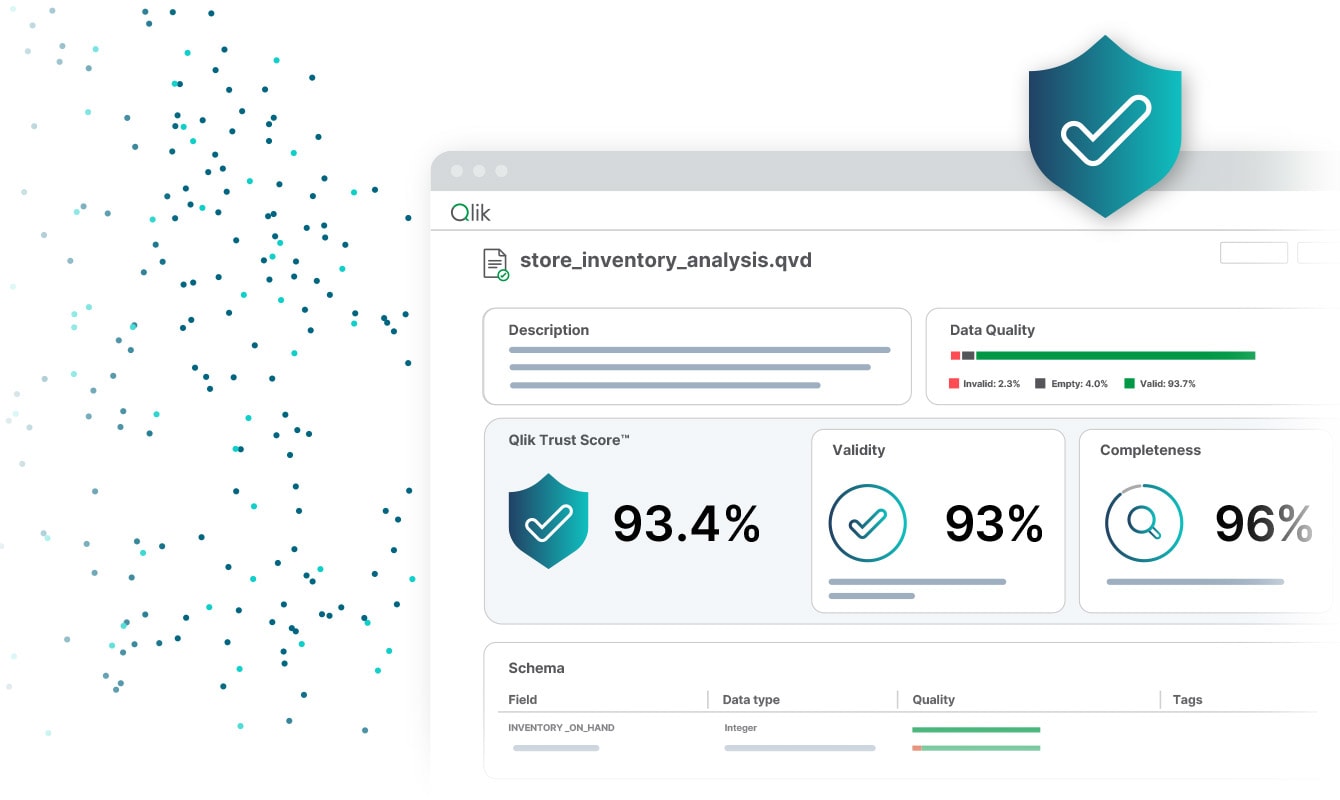
Trust Scores

An image displaying a "Trust Score" of 98, accompanied by a graphic representing 100% satisfaction, with icons denoting various feedback metrics.

Trust Scores

Every dataset gets a Qlik Talend Trust Score to show quality, popularity, and usage — making it easy to decide what data to use and share.

Easily Share

Software interface shows option to add collaborators along with conceptual entry fields and column types.

Easily Share

Tag, annotate, and share datasets in a user-friendly space built for business and tech teams alike — driving better collaboration and data reuse.

Secure Access

An illustration of software interface showing a confirmation message "The connection was created successfully." above a form labeled "Add custom attributes.

Secure Access

Set access rules anyone controls from one place so users only see what they need, keeping data usage secure, compliant, and under control.

Team Collaboration

Diagram showing a table with columns "Member_Type" and "First_Name" and rows filled with data. Connected user icons on the left and export/share buttons on the right side of the table.

Team Collaboration

Share preparation steps across teams for faster, more consistent data work.

Reusable Pipelines

A diagram showing data sources such as AWS, Salesforce, and others flowing into Qlik, which then processes and outputs the data.

Reusable Pipelines

Turn prep tasks into repeatable flows that update on schedule from trusted sources.

Built-in Data Security

A graphical representation of data masking with a blurred background, showing a table labeled 'Member_Type' and 'Company,' with a dialogue box labeled 'Mask Data' and a 'Submit' button.

Built-in Data Security

Use role-based controls and masking rules to protect sensitive data and support compliance.

Guided Data Validation

Software interface displays options to accept or reject changes. Sections for "First_Name," "Data Cleansing," and "Conversions" with associated fields are shown.

Guided Data Validation

Stewards receive ML‑driven recommendations and rule templates to help correct inconsistencies quickly and accurately.

Certification Tracking

Line graph showing tasks resolved before due dates from October 2022 to January 2023, with a dropdown listing Salesforce 90%, Marketo 50%, and Netsuite 25%. In December, tasks resolved dropped to 30%.

Certification Tracking

Track data approvals with audit logs and status updates, providing a clear certification trail for compliance.

Visibility & Accountability

A progress tracker with bars in various stages of completion. A box at the top shows "19 days, 23 hours" remaining. An additional box contains an icon and text lines.

Visibility & Accountability

Dashboards show stewardship progress and issue backlogs, keeping teams aware of data health and responsibilities.

Simplify Complex Integrations

Illustration of a data flow diagram with four green circles representing a database, document, cloud, and transmission tower, connected by horizontal lines.

Simplify Complex Integrations

Streamline complex JSON, AVRO, XML, and B2B integrations using advanced data mapping transformation tools and industry standards such as HL7 and EDI

Increase Productivity

Illustration of a computer screen displaying various data and charts overlayed on a blurred background. Graphs and diagrams appear to be floating above the main screen.

Increase Productivity

A single, unified platform for API development, application, data integration, and data quality.

Solve your data challenges today