*Based on the list of 2025 Fortune 500® companies with recurring revenue to Qlik during the 12-month period ending June, 2025. Fortune 500 is a registered trademark of Fortune Media IP Limited. Qlik is not affiliated with or endorsed by Fortune.
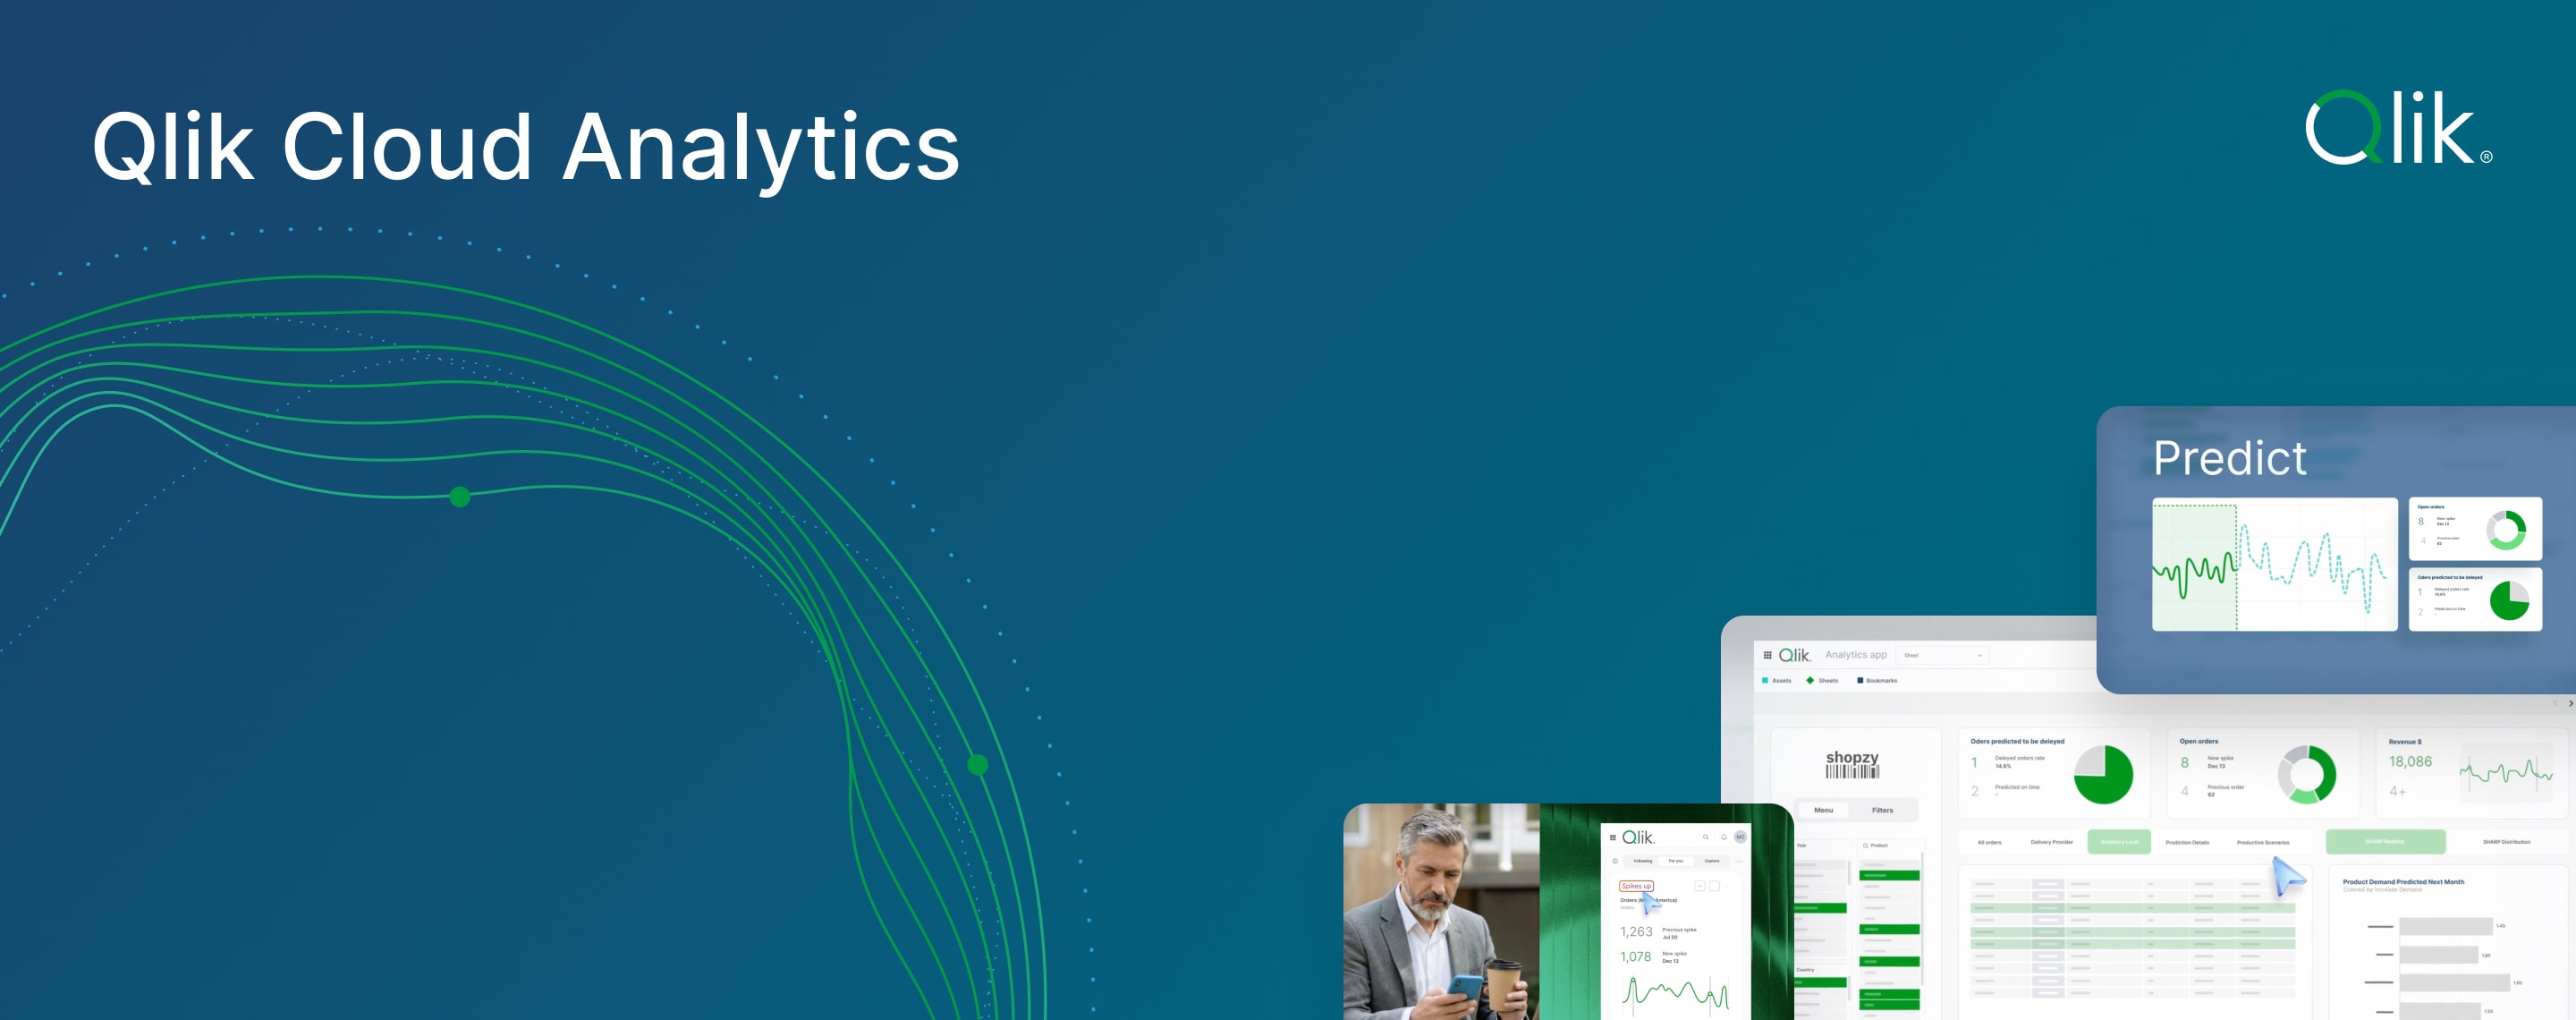
QLIK CLOUD ANALYTICS®
Inform Every Decision
with Agentic Analytics
Enable everyone in your organization to make data-driven decisions and take effective action. Save time, increase adoption, and see faster time to value.
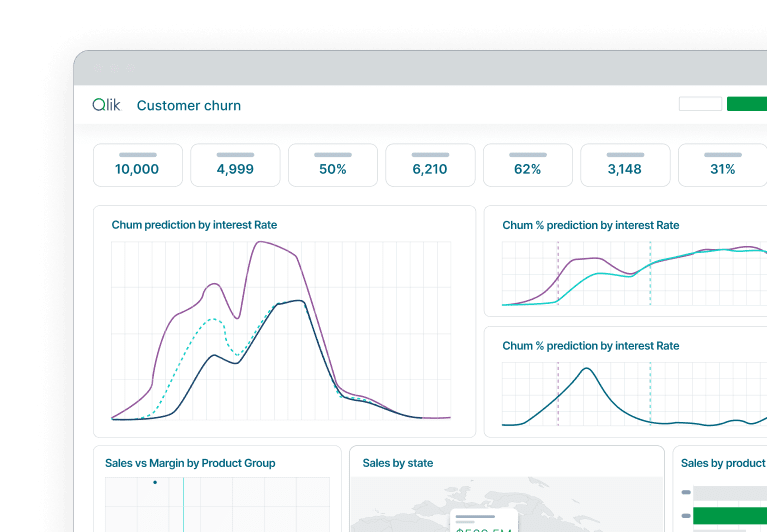
Interactive Analytics

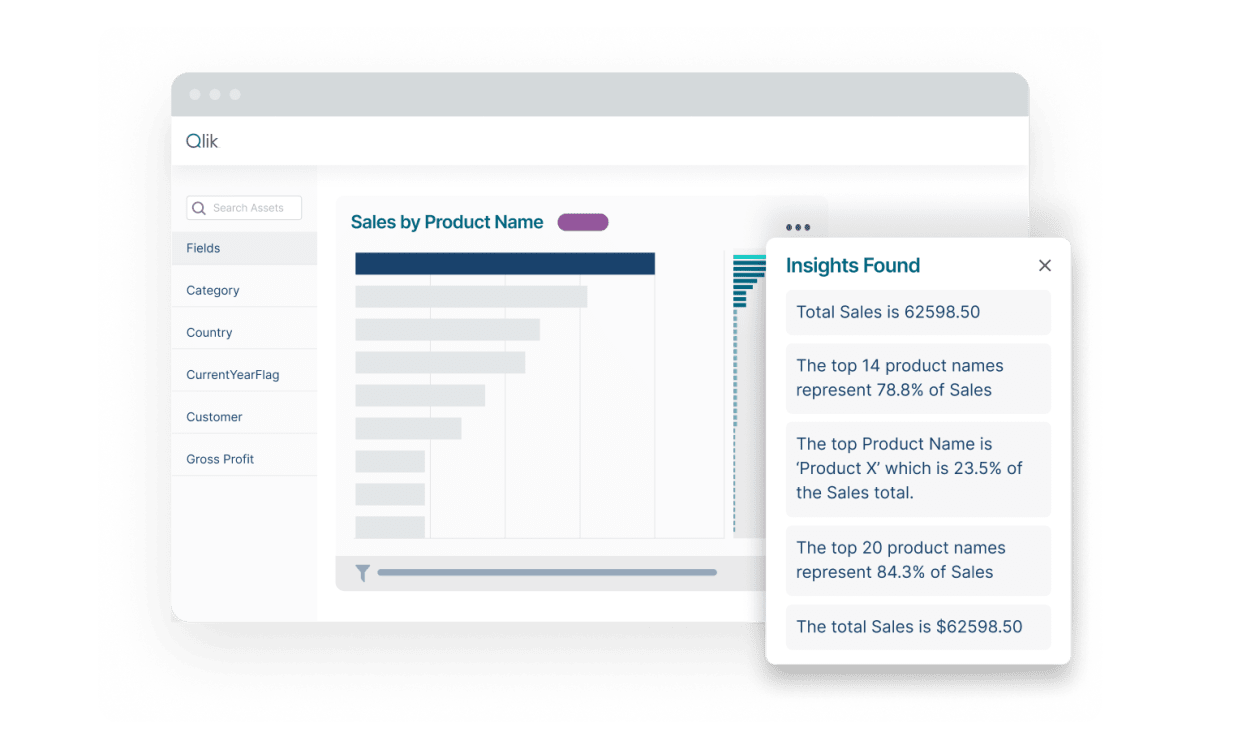
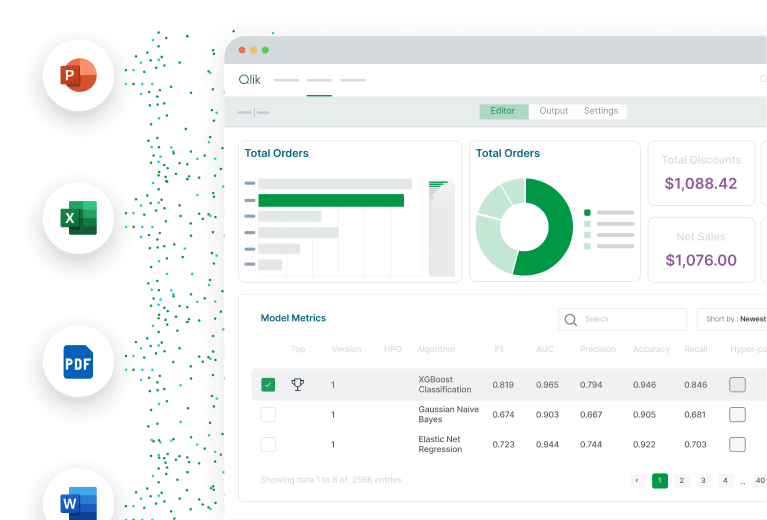
Gen AI Insights
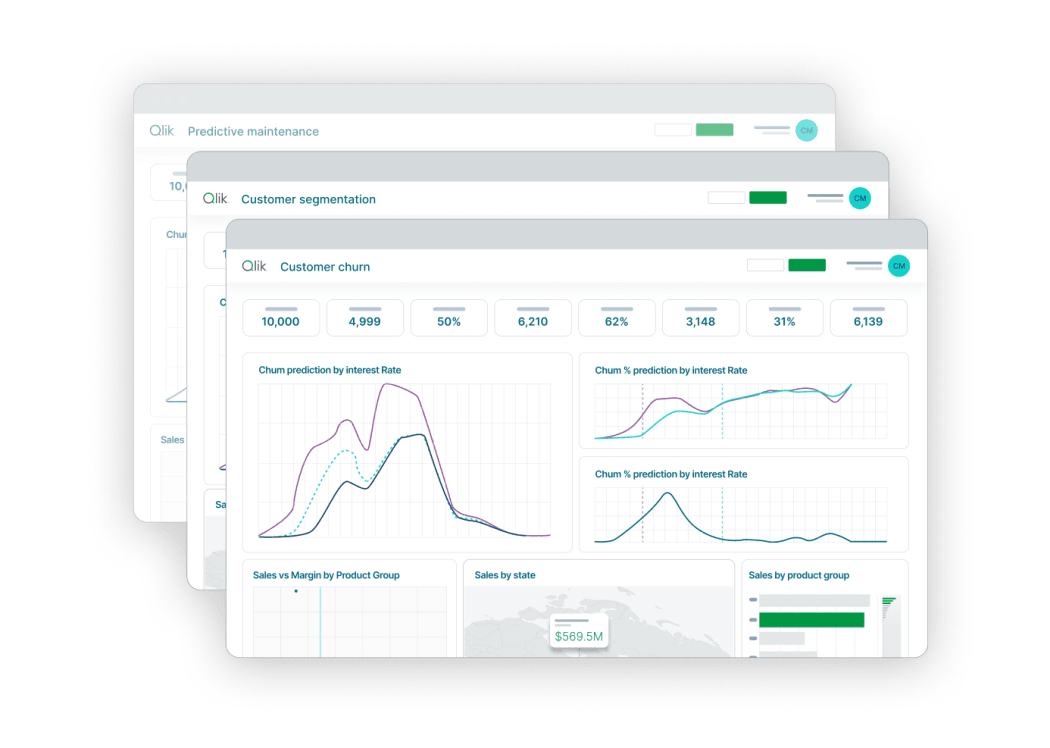
Predictive Analytics
Advanced AI Integrations
Report Distribution

Monitoring & Alerting
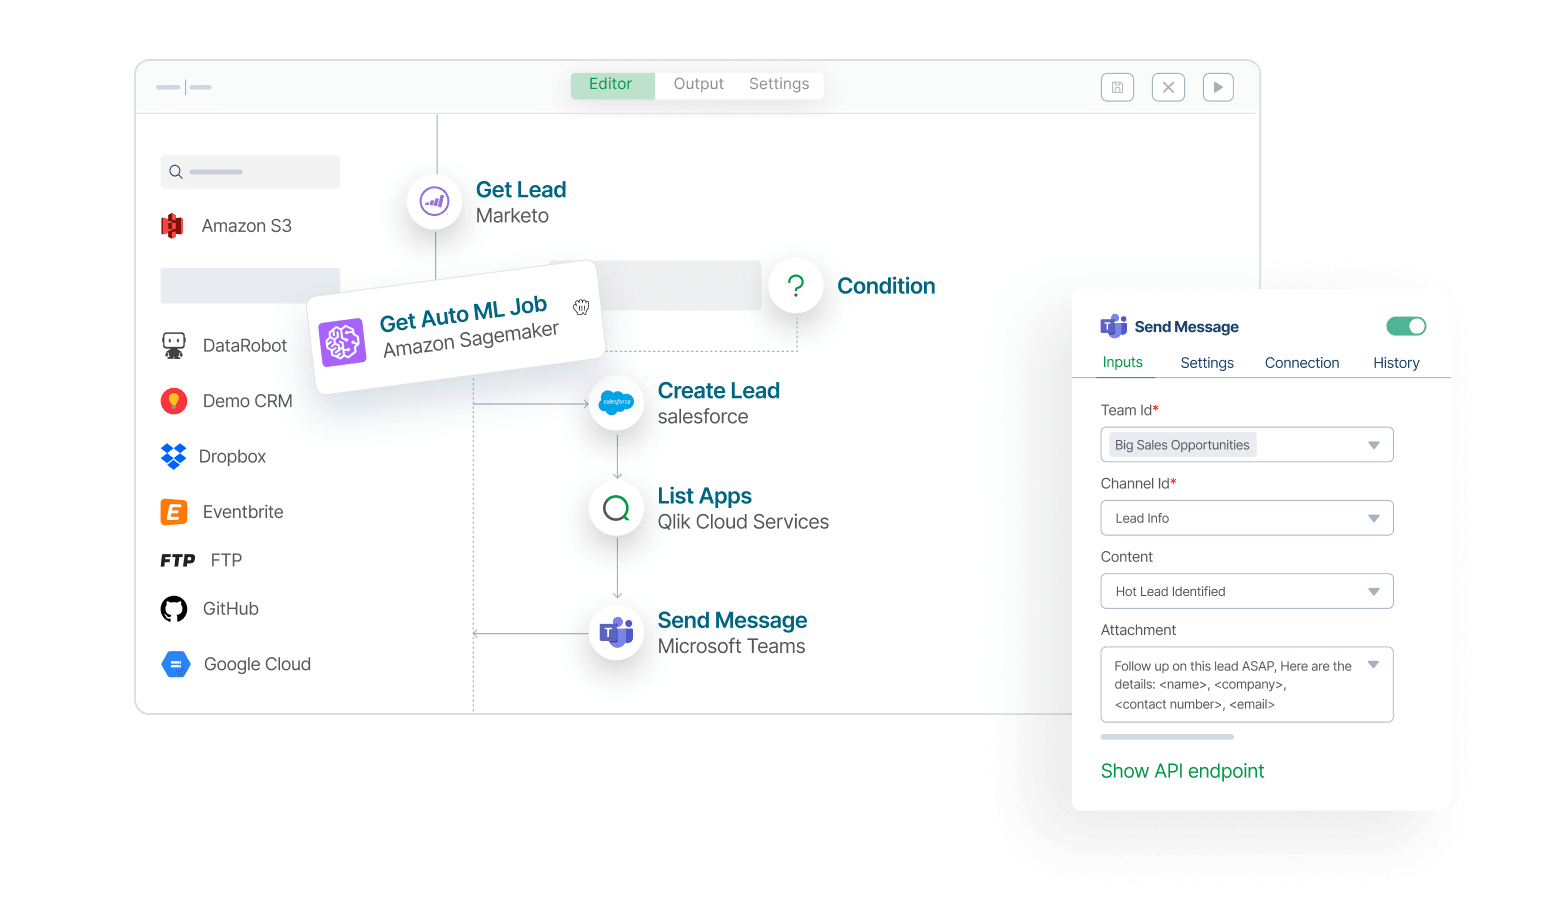
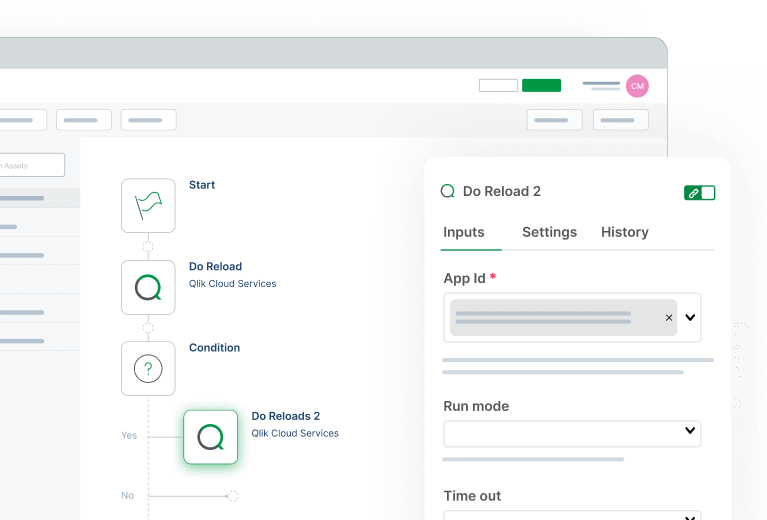
Automation & Orchestration

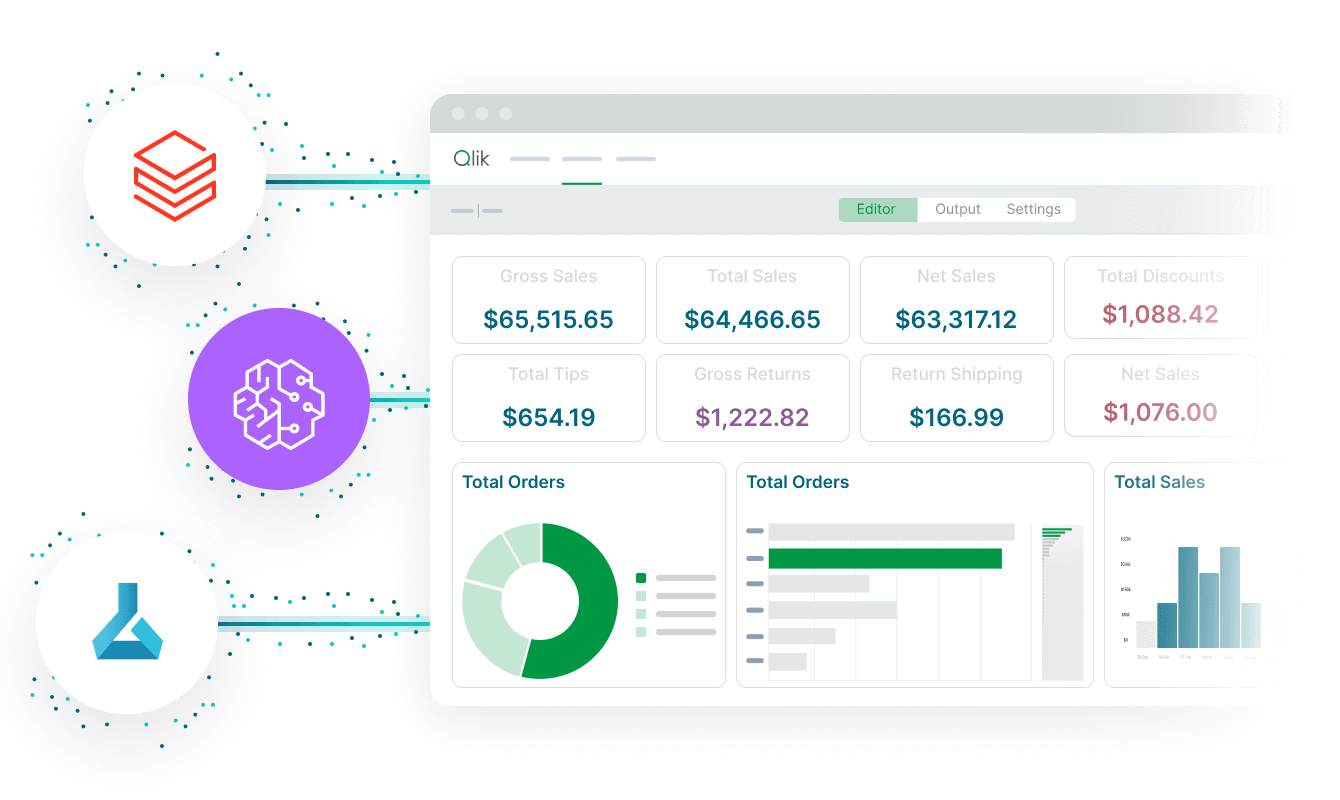
No-Code Data Prep

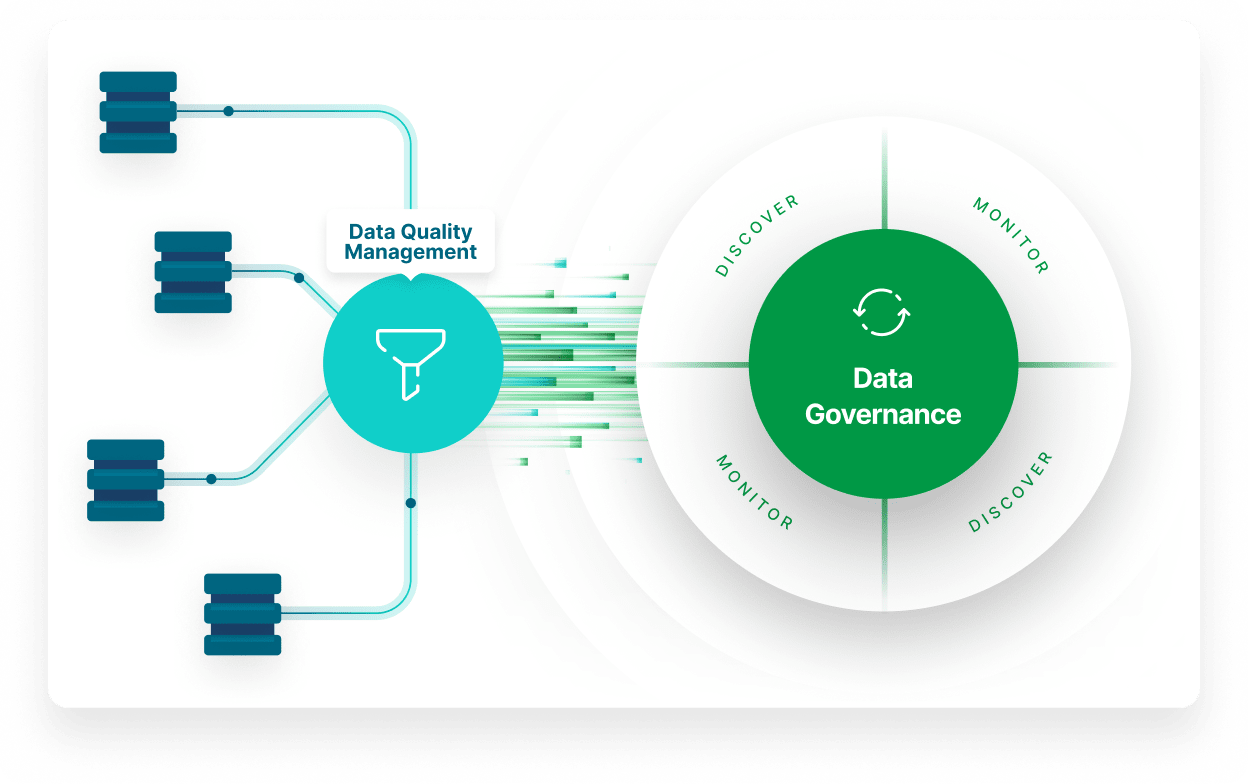
Built-In Data Quality
Deliver rich insight and powerful action

75% of the Fortune 500® use Qlik*
Award-winning innovation
Recognized by leading analysts and industry organizations for data, analytics, and AI.
Realize unprecedented time to value
Qlik Cloud Analytics delivers the foundation for modern enterprises – enabling productivity, scalability, and AI-driven insights at every level.

Agentic Framework
Monitor your data and take action, automate tasks and workflows, and embed analytics into popular AI assistants and applications.
Learn More
One-of-a-kind Qlik Analytics Engine
Deliver fast contextual analytical calculations from all your data, supporting user exploration and agentic reasoning at scale.
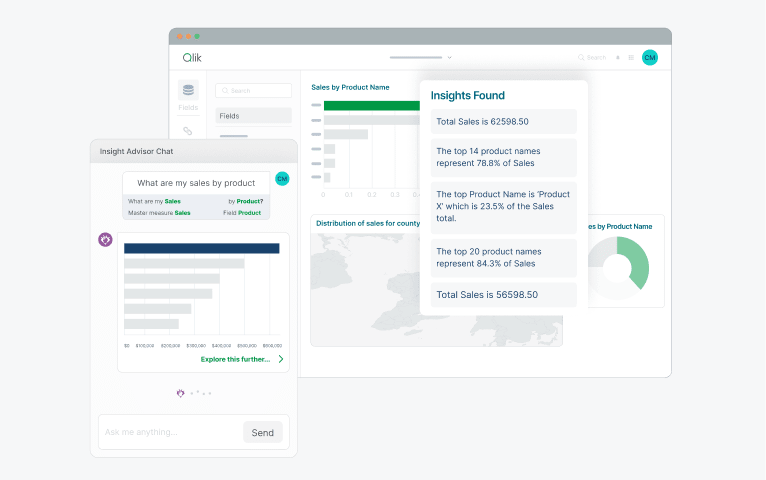
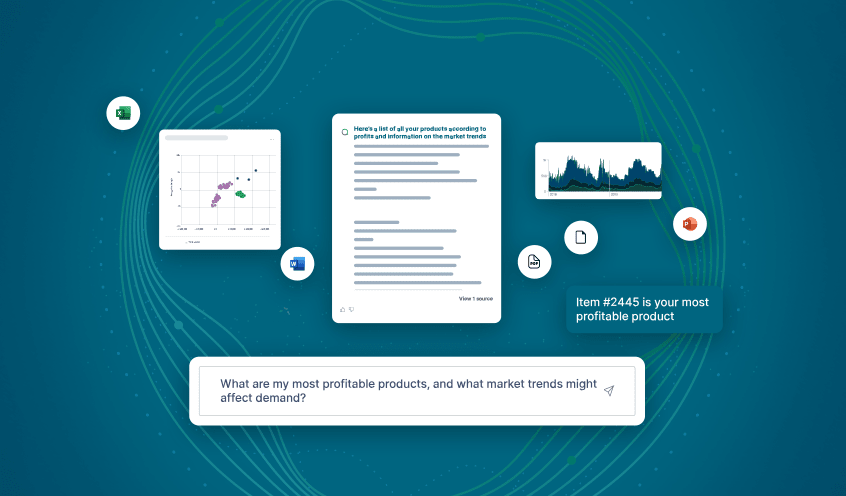
Natural Language Assistant
Empower business users with insight, assistance, and automation through an agentic experience that drives productivity.
Learn More
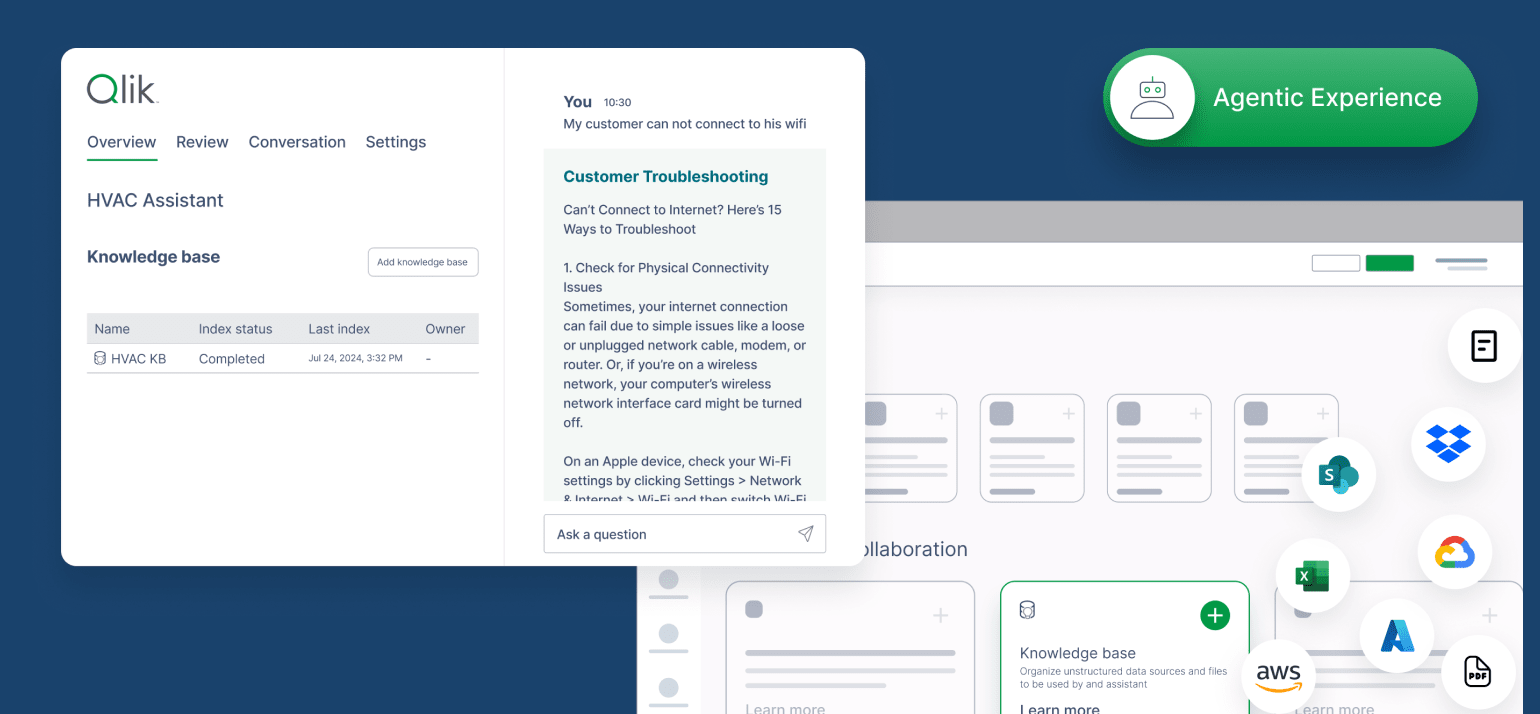
Embed Anywhere
Embed Agentic AI assistants directly into your applications and workflows, bringing trusted, context-aware insights and actions to users exactly where work happens.
Learn More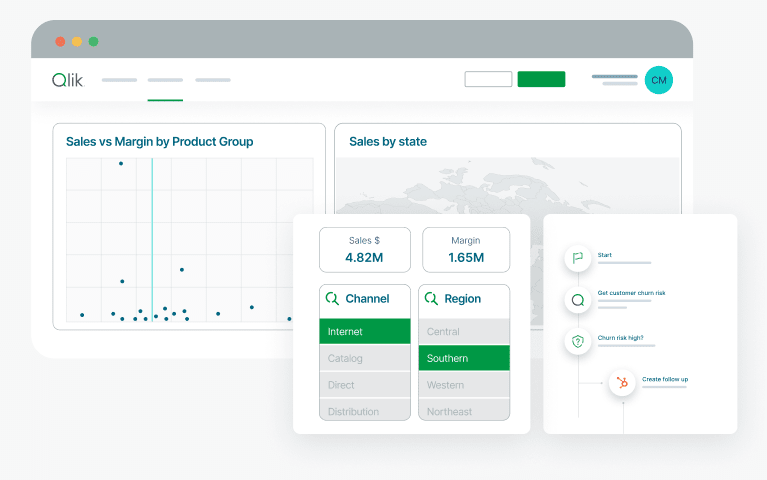
Productivity
Empower teams to explore data freely, uncover insights instantly, and move from analysis to action without friction.
Unlock Cloud Intelligence with Qlik
Move your analytics to Qlik Cloud and unlock faster, smarter insights with built-in automation and AI. Experience seamless migration, lower costs, and always-on innovation powered by Qlik.
Unlock the power of your trusted data with speed and cost efficiency
From executives to analysists, every team gets the insights they need, powered by AI, scale, and governance.

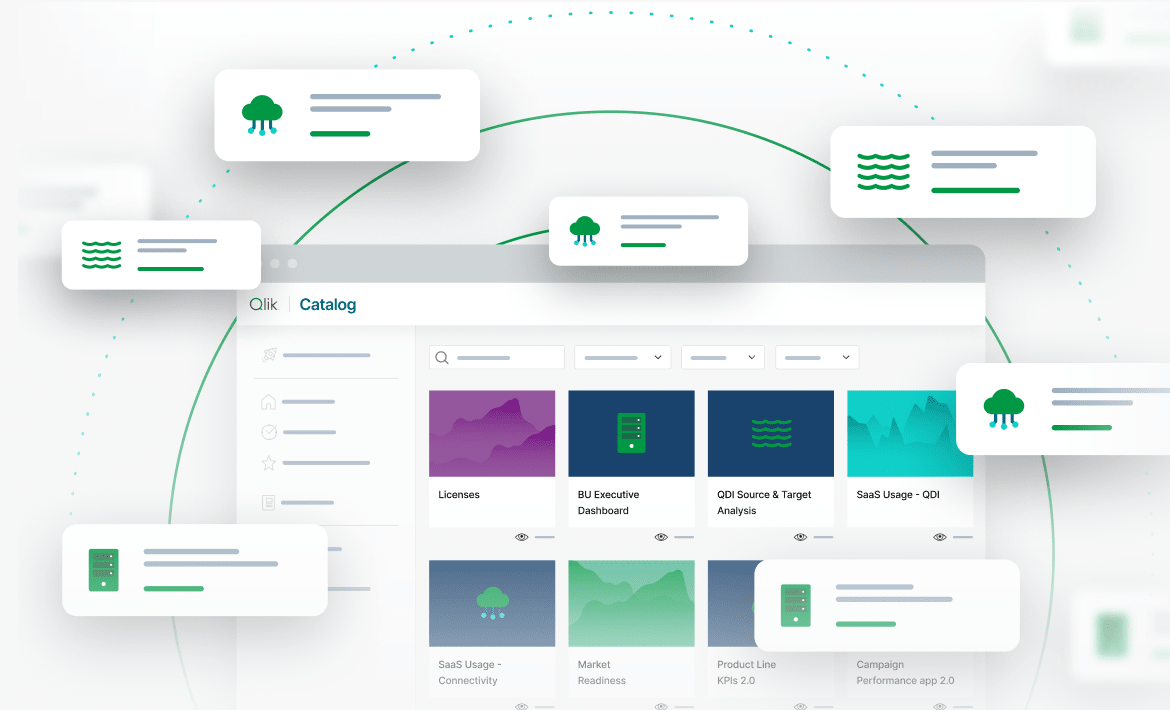
Give AI the broadest access to your data from across your organization through high-quality curated datasets, available in real time.

Our unique analytics engine unlocks the power of your data with context awareness that supports multi-step “chain of thought” reasoning for both users and AI agents.
Get deep, contextually relevant answers to open-ended and speculative questions through unique agentic reasoning. Allow purpose-built AI agents to do the heavy lifting.
THE STATE OF AGENTIC
The State of Agentic AI is Here
79% of enterprise leaders say agentic AI is critical to their strategy, yet only 18% have fully deployed it. Find out what's standing in the way (and how to fix it).

Put Qlik analytics to work for you


Customers making data work for AI