


DATA MAPPING SOFTWARE
Accelerate Business Insights with Qlik's Intelligent Data Mapping Software
Ensure accurate and efficient data integration with Qlik's data mapping software that visually maps, transforms, and governs data across sources for trusted analytics at scale.

Simplify integration with intelligent, automated data mapping
Transform complex data integration challenges into streamlined processes with visual mapping tools that automate field-level transformations and ensure data accuracy across systems.
Automate field mapping with AI-powered recommendations
Accelerate mapping projects with intelligent algorithms that automatically suggest field relationships and transformations based on data types, naming patterns, and semantic analysis.
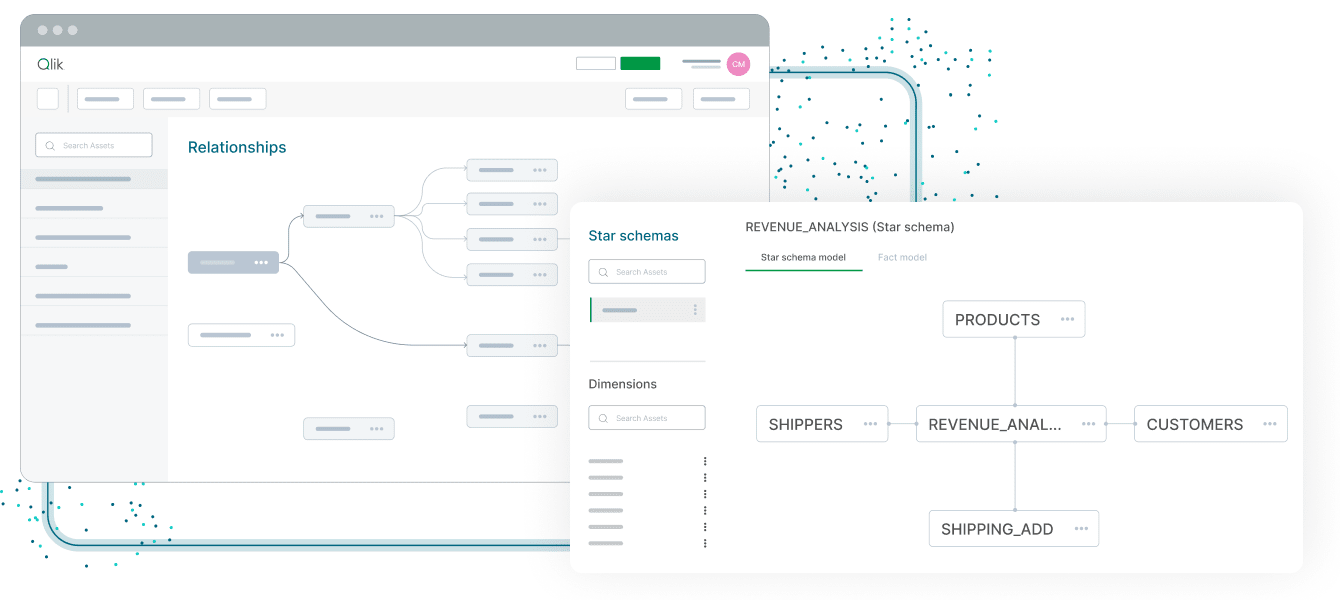
Visualize data relationships across complex systems
Understand data flows and dependencies through intuitive visual interfaces that show how data moves and transforms across your entire integration landscape.
Ensure accuracy with governed mapping frameworks
Maintain data quality and consistency with centralized mapping repositories, version control, and governance frameworks that ensure reliable data integration across the enterprise.
How does Qlik's data mapping software work?
Step 1 - Connect to source and target systems
Step 2 - Map fields visually with drag-and-drop interfaces
Step 3 - Transform and validate data with built-in functions
Step 4 - Deploy and monitor mappings with automated testing

Why choose Qlik for data mapping?
Enterprise-grade capabilities designed for intelligent data mapping
AI-powered mapping recommendations and automation
Accelerate mapping projects by up to 80% with intelligent algorithms that automatically suggest field mappings, transformations, and data quality rules based on semantic analysis and historical patterns.
Visual, intuitive mapping interface for all skill levels
Enable both technical and business users to create and understand data mappings through drag-and-drop visual interfaces that require no coding expertise.

Centralized mapping repository with version control
Maintain a single source of truth for all data mappings with centralized repositories, version control, and impact analysis that ensure consistency across projects.

Seamless integration with enterprise data platforms
Deploy mappings across any integration platform with native support for leading ETL tools, data warehouses, and cloud platforms through standard export formats.

Trusted by enterprises for mission-critical integrations
Join organizations that have successfully automated thousands of data mappings with proven accuracy, reliability, and significant time savings on integration projects.
Key capabilities of Qlik's data mapping software
Comprehensive mapping capabilities for enterprise data integration
Intelligent field-level mapping with semantic analysis
Automatically map fields across source and target systems with AI algorithms that understand data semantics, naming conventions, and business context.
Visual transformation design and testing
Design complex transformations through visual interfaces with built-in functions for data type conversion, calculations, and business logic implementation.
Automated schema discovery and profiling
Automatically discover and profile source and target schemas with detailed metadata analysis that provides insights into data types, patterns, and quality.
Reusable mapping templates and components
Accelerate projects with reusable mapping templates, standard transformations, and component libraries that ensure consistency across integrations.
Impact analysis and dependency tracking
Understand the impact of mapping changes with automated dependency tracking and impact analysis that shows downstream effects across integration flows.
Enterprise-grade security and audit trails
Maintain comprehensive security with role-based access controls, encryption, and complete audit trails that track all mapping changes and deployments.
Trusted by leading enterprises worldwide
What our customers say
We needed to consolidate data in one place, from heterogeneous sources, updated in almost real-time. That’s what Qlik enables for us.
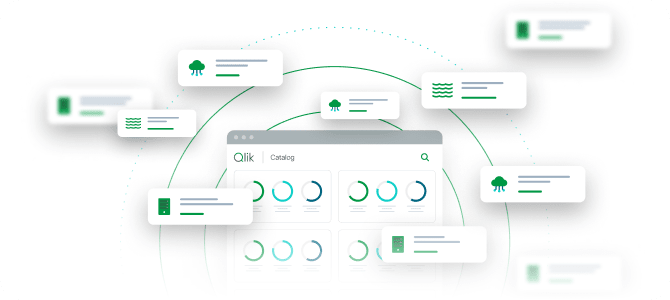
Connect to 500+ data sources with Qlik’s analytics integrations
SAP
Adobe
IBM

AWS

MySQL

Jira

Azure
MS SQL

Apache

Mongo DB
SAP
Adobe
IBM
AWS
MySQL
Jira
Azure
MS SQL
Apache
Mongo DB
SAP
Adobe
IBM
AWS
MySQL
Jira
Azure
MS SQL
Apache
Mongo DB
SAP
Adobe
IBM
AWS
MySQL
Jira
Azure
MS SQL
Apache
Mongo DB
SAP
Adobe
IBM
AWS
MySQL
Jira
Azure
MS SQL
Apache
Mongo DB
Oracle
Salesforce
Workday
Apache Iceberg

CircleCI

Zendesk

Snowflake

Databricks


OpenAI
Intuit
Oracle
Salesforce
Workday
Apache Iceberg
CircleCI
Zendesk
Snowflake
Databricks
OpenAI
Intuit
Oracle
Salesforce
Workday
Apache Iceberg
CircleCI
Zendesk
Snowflake
Databricks
OpenAI
Intuit
Oracle
Salesforce
Workday
Apache Iceberg
CircleCI
Zendesk
Snowflake
Databricks
OpenAI
Intuit
Oracle
Salesforce
Workday
Apache Iceberg
CircleCI
Zendesk
Snowflake
Databricks
OpenAI
Intuit
Resources to help you succeed with data mapping


Data mapping software FAQs
Our AI algorithms analyze source and target schemas, data types, naming patterns, and business context to automatically suggest field mappings and transformations, reducing manual mapping time by up to 80% while maintaining high accuracy.
Yes, our platform includes extensive transformation libraries with hundreds of built-in functions for data type conversion, calculations, string manipulation, and business logic implementation, plus support for custom transformation code.
Our centralized repository stores all mappings with version control, metadata, and lineage tracking, enabling teams to reuse proven mappings, maintain consistency, and perform impact analysis when changes are needed.
We provide native integration with leading ETL tools, data integration platforms, and cloud services through standard export formats including XML, JSON, and platform-specific formats for seamless deployment.