


DATA DISCOVERY PLATFORM
Accelerate Insights with Qlik's Data Discovery Platform
Unlock hidden insights with Qlik's data discovery platform that empowers teams with self-service discovery, governed data, and AI-powered analytics for faster decisions across your enterprise.

Empower every team with self-service discovery and trusted insights
Transform how your organization discovers and analyzes data with intuitive tools that enable business users to find insights independently while maintaining governance and security.
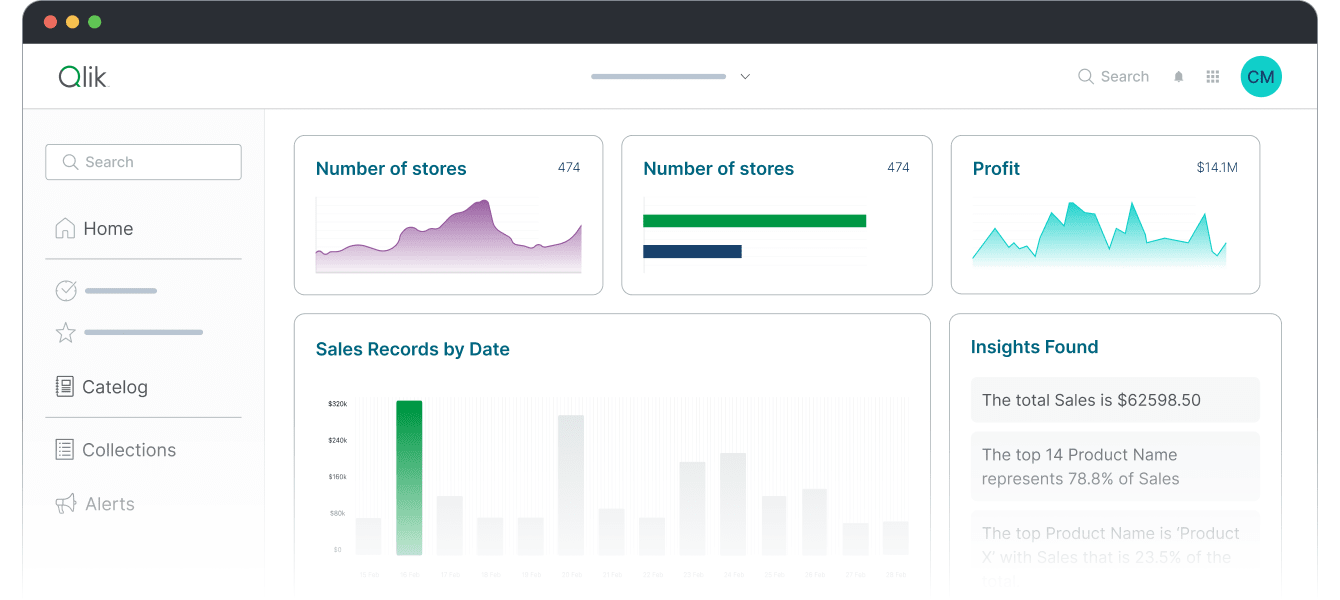
Explore business data with AI-powered visualizations
Discover patterns and insights through intelligent visualizations that automatically suggest the best ways to explore and understand your data.
Enable self-service analytics with governed access
Empower business users to explore data independently through intuitive self-service tools while maintaining centralized governance and security controls.
Deliver faster decisions with enterprise-grade discovery
Accelerate decision-making with real-time data exploration capabilities that provide immediate insights without requiring technical expertise or IT intervention.
How does Qlik's data discovery platform work?
Step 1 - Connect and explore data from any source
Step 2 - Cleanse, transform, and organize data for discovery
Step 3 - Generate interactive visualizations and insights

Why Qlik data discovery?
Enterprise-grade capabilities designed for intuitive data discovery

Enterprise-grade governance with trusted data
Maintain complete control over data access and quality with comprehensive governance frameworks that ensure users explore trusted, validated data across all discovery activities.

Seamless scalability across teams and cloud environments
Scale data discovery capabilities across your entire organization with cloud-native architecture that grows with your needs without sacrificing performance or user experience.
Intuitive, easy-to-use platform for business users
Enable non-technical users to discover insights independently through natural language queries, smart visualizations, and guided exploration that requires no coding skills.

Advanced capabilities for data teams and analysts
Provide data professionals with sophisticated tools for complex analysis, custom visualizations, and advanced analytics while maintaining accessibility for all user types.

Proven success across global enterprises
Join organizations worldwide that have transformed their decision-making through self-service data discovery with measurable improvements in speed and insight quality.
Key capabilities of Qlik's data discovery software
Comprehensive discovery capabilities for enterprise analytics
AI-enhanced visual data discovery
Discover insights faster with AI-powered visualization recommendations that automatically suggest the most effective ways to explore and analyze your data.
Interactive dashboards and reports
Create dynamic, interactive dashboards and reports that enable deep exploration and analysis through intuitive drill-down and filtering capabilities.
Search and explore with natural language queries
Ask questions about your data in plain English and receive instant visualizations and insights without requiring technical query language knowledge.
Self-service access with governance controls
Enable users to access and explore data independently while maintaining centralized governance, security policies, and data quality standards.
Real-time data exploration across sources
Explore data from multiple sources in real-time with unified access that eliminates silos and provides complete visibility across your data landscape.
Enterprise-grade security and compliance
Implement comprehensive security controls, role-based access management, and compliance frameworks that protect sensitive data during discovery activities.
Trusted by leading enterprises worldwide
What our customers say
We needed to consolidate data in one place, from heterogeneous sources, updated in almost real-time. That’s what Qlik enables for us.
Connect to 500+ data sources with Qlik’s analytics integrations
SAP
Adobe
IBM

AWS

MySQL

Jira

Azure
MS SQL

Apache

Mongo DB
SAP
Adobe
IBM
AWS
MySQL
Jira
Azure
MS SQL
Apache
Mongo DB
SAP
Adobe
IBM
AWS
MySQL
Jira
Azure
MS SQL
Apache
Mongo DB
SAP
Adobe
IBM
AWS
MySQL
Jira
Azure
MS SQL
Apache
Mongo DB
SAP
Adobe
IBM
AWS
MySQL
Jira
Azure
MS SQL
Apache
Mongo DB
Oracle
Salesforce
Workday
Apache Iceberg

CircleCI

Zendesk

Snowflake

Databricks


OpenAI
Intuit
Oracle
Salesforce
Workday
Apache Iceberg
CircleCI
Zendesk
Snowflake
Databricks
OpenAI
Intuit
Oracle
Salesforce
Workday
Apache Iceberg
CircleCI
Zendesk
Snowflake
Databricks
OpenAI
Intuit
Oracle
Salesforce
Workday
Apache Iceberg
CircleCI
Zendesk
Snowflake
Databricks
OpenAI
Intuit
Oracle
Salesforce
Workday
Apache Iceberg
CircleCI
Zendesk
Snowflake
Databricks
OpenAI
Intuit
Resources to help you succeed with data discovery


Data discovery platform FAQs
Our platform emphasizes intuitive, self-service exploration with AI-powered recommendations and natural language queries, enabling business users to discover insights independently without requiring extensive training or technical expertise.
Yes, our intuitive interface with natural language queries, smart visualizations, and guided exploration enables business users to discover insights independently while IT maintains governance and security controls in the background.
We implement comprehensive governance frameworks with role-based access controls, data masking, audit logging, and automated security policies that ensure users only access authorized data during discovery activities.
Our platform supports a wide range of visualizations from basic charts to advanced geospatial and statistical analyses, with AI-powered recommendations that suggest the most effective visualizations for your specific data and questions.