


Transform complex data into strategic business insights
Leverage Qlik’s end-to-end big data analytics platform to connect, prepare, and analyze data at scale — turning complexity into clarity.
Handle massive volumes of data with speed and agility
Process streaming, batch, and historical data in real time with a high-performance, scalable analytics engine.
Break down silos with unified data analytics across sources
Integrate structured, semi-structured, and unstructured data from any source into a single, governed environment.
Drive smart decisions with AI-powered insights in real time
Empower teams with predictive models, automated recommendations, and instant answers to critical business questions.
How does Qlik's big data analytics platform work?
Step 1: Ingest data from distributed, real-time, and historical sources
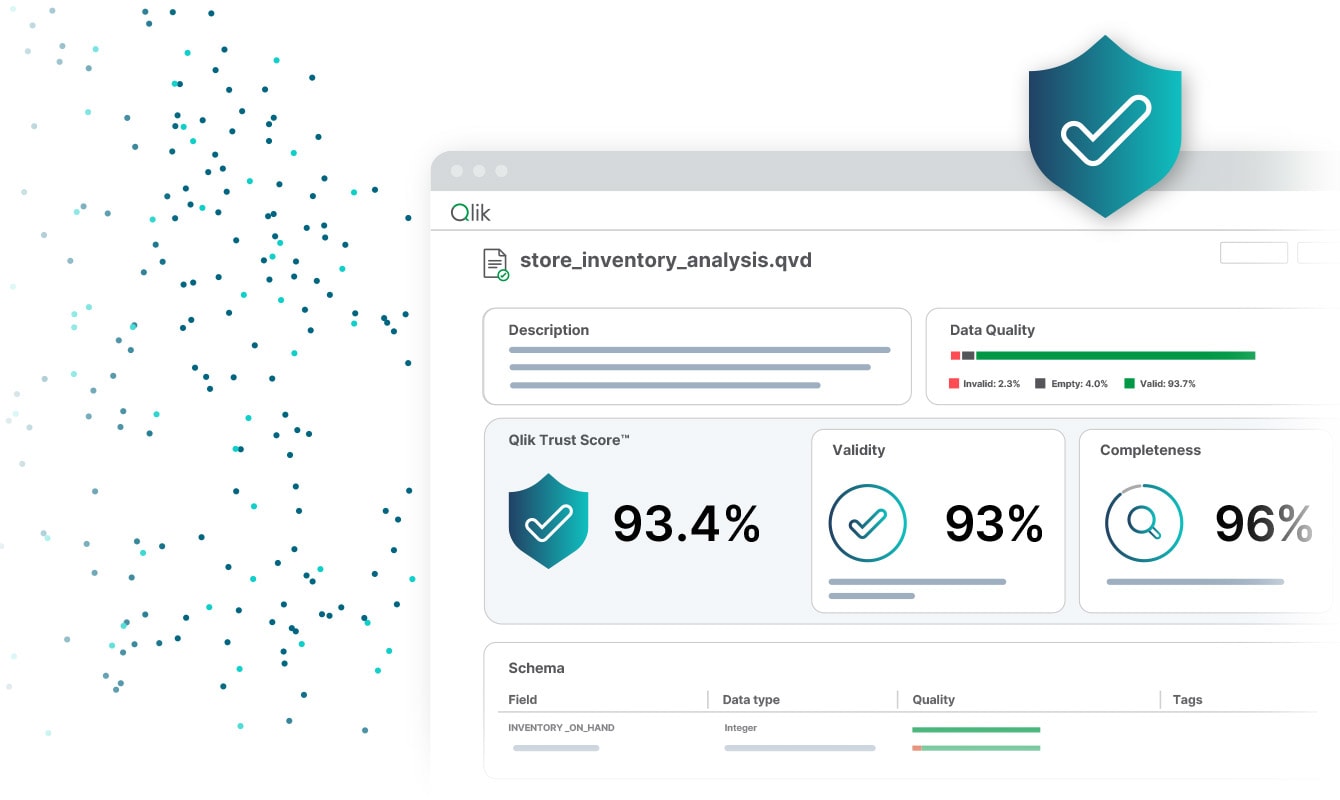
Step 2: Use AI and machine learning to clean and enrich data
Step 3: Visualize, predict, and explore at petabyte scale
Step 4: Operationalize insights and automate business actions
Why choose Qlik for big data analytics?
Harness massive, diverse datasets with an AI-powered, cloud-native platform designed for speed, scale, and smarter decision-making.


High-performance processing for streaming and batch data
Ingest, transform, and analyze large data volumes in real time or on schedule — without sacrificing accuracy or speed.
Cloud-native architecture with enterprise-grade security
Run in any cloud or hybrid environment with built-in governance, compliance, and robust data protection.

Built for technical and non-technical users
From drag-and-drop dashboards to custom scripting, Qlik delivers flexibility for business users and data experts alike.

Trusted across industries for mission-critical decisioning
Join global enterprises using Qlik to solve complex challenges, drive innovation, and improve outcomes.
Core capabilities of Qlik's big data analytics software
Unify, analyze, and act on massive datasets with an end-to-end platform built for speed, flexibility, and enterprise-scale insights.
Distributed data integration and real-time ingestion
Continuously capture, transform, and deliver data from any source — structured or unstructured — into analytics-ready formats.
Predictive analytics and intelligent alerts
Anticipate trends, identify risks, and trigger timely actions with AI-driven forecasting and customizable notifications.
Advanced visualizations and self-service dashboards
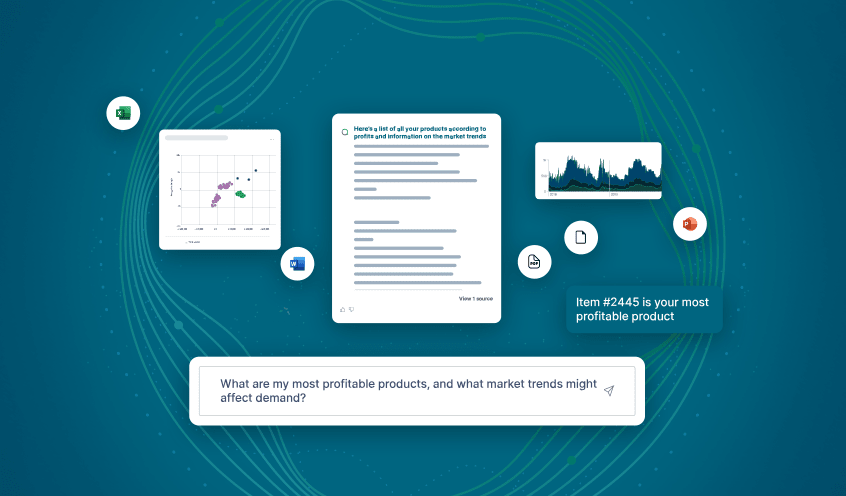
AI-powered natural language querying
Ask questions in plain language and receive immediate, contextual answers backed by your complete dataset.
Governance, compliance, and access controls
Protect sensitive data with built-in governance, role-based permissions, and adherence to industry regulations.
Scalable deployment across multi-cloud and on-premises
Run Qlik seamlessly in public cloud, private cloud, or on-premises environments — optimized for growth and agility.
Real-time analytics in action
Customer Testimonials: Real-World Results
We started an automation process with Qlik and now we only have half the people managing reports. The other half is doing activities allowing us to leapfrog the competition by providing even more proactive analytics vs. reactive.
SAP
Adobe
IBM

AWS

MySQL

Jira

Azure
MS SQL

Apache

Mongo DB
SAP
Adobe
IBM
AWS
MySQL
Jira
Azure
MS SQL
Apache
Mongo DB
SAP
Adobe
IBM
AWS
MySQL
Jira
Azure
MS SQL
Apache
Mongo DB
SAP
Adobe
IBM
AWS
MySQL
Jira
Azure
MS SQL
Apache
Mongo DB
SAP
Adobe
IBM
AWS
MySQL
Jira
Azure
MS SQL
Apache
Mongo DB
Oracle
Salesforce
Workday
Apache Iceberg

CircleCI

Zendesk

Snowflake

Databricks


OpenAI
Intuit
Oracle
Salesforce
Workday
Apache Iceberg
CircleCI
Zendesk
Snowflake
Databricks
OpenAI
Intuit
Oracle
Salesforce
Workday
Apache Iceberg
CircleCI
Zendesk
Snowflake
Databricks
OpenAI
Intuit
Oracle
Salesforce
Workday
Apache Iceberg
CircleCI
Zendesk
Snowflake
Databricks
OpenAI
Intuit
Oracle
Salesforce
Workday
Apache Iceberg
CircleCI
Zendesk
Snowflake
Databricks
OpenAI
Intuit
Resources to Maximize the Value of Big Data Analytics


Big data analytics FAQs
It’s the use of processes and technologies to combine and analyze massive datasets — structured, semi-structured, or unstructured — to identify patterns and derive actionable insights that help make faster, smarter decisions.
The process typically involves defining objectives, collecting data, integrating and managing it, analyzing it, and sharing findings. This often requires tools or platforms that can handle large volumes and complex data types such as streaming and unstructured data.
AI and ML automate analysis, suggest insights, enable predictive analytics, and support natural language querying — making it faster and easier to derive value from big data.