CUSTOMER STORY // EDULUTION
Edulution and Qlik Enable New Perspectives on Education for Children in South Africa and Zambia
Nonprofit harnesses Qlik Cloud Analytics to track key indicators and optimize critical outcomes for over 18,000 learners.
32%
more effective learning
The filterable indicators and insights enabled by Qlik allow Edulution to deliver transformative, tailored teaching.
60,000+
children benefited
Over 60,000 learners in Zambia and South Africa have experienced Edulution’s data-led approach.
Transparent
data delivers key outcomes
From individual learner progress to high-level management reporting, Edulution is harnessing Qlik to optimize its operations.
CHALLENGE
Filling the gaps to transform educational outcomes
Around 90% of the world’s young population live in developing countries. And while access to education in countries such as South Africa and Zambia is rising, it’s often easy for young learners to fall significantly below target grade levels.
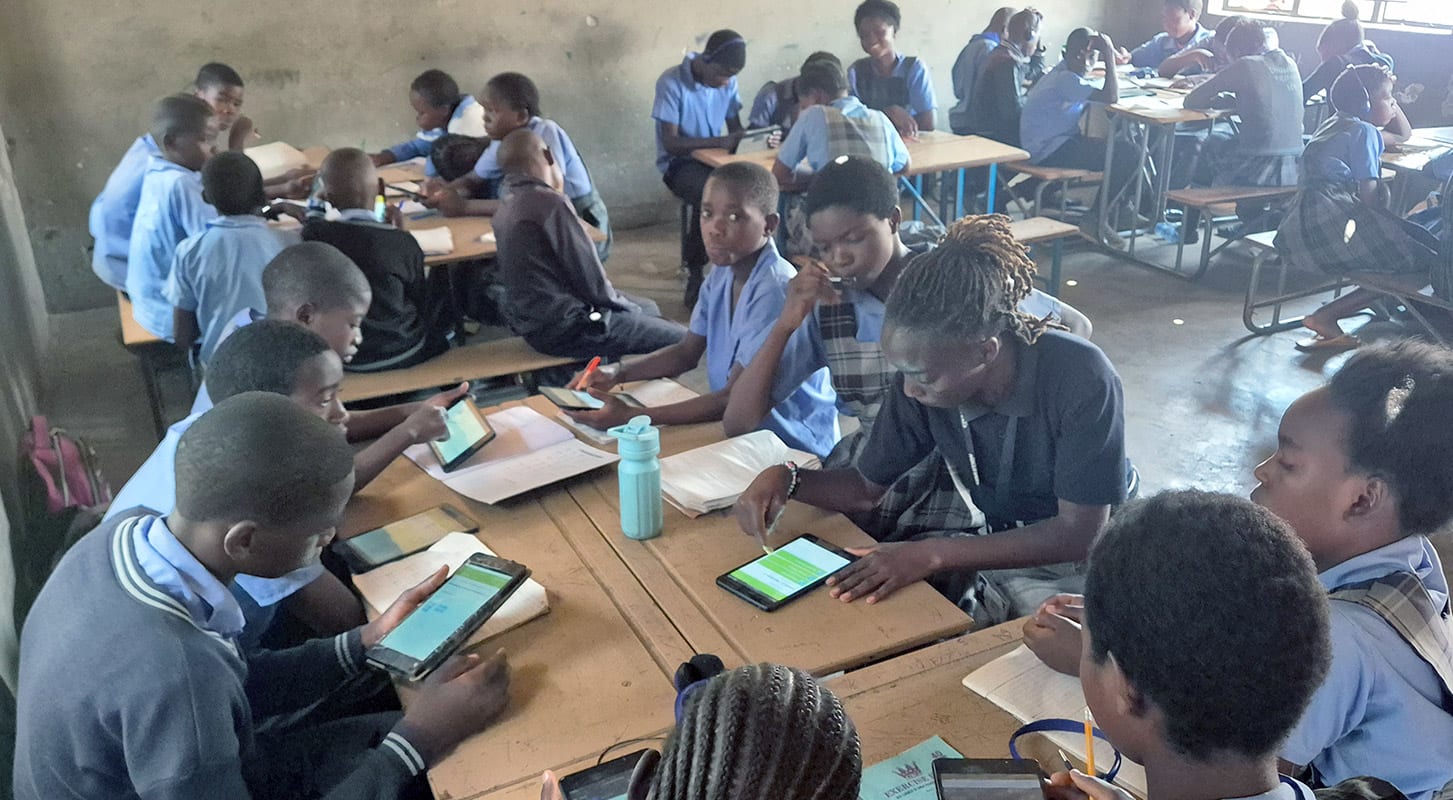
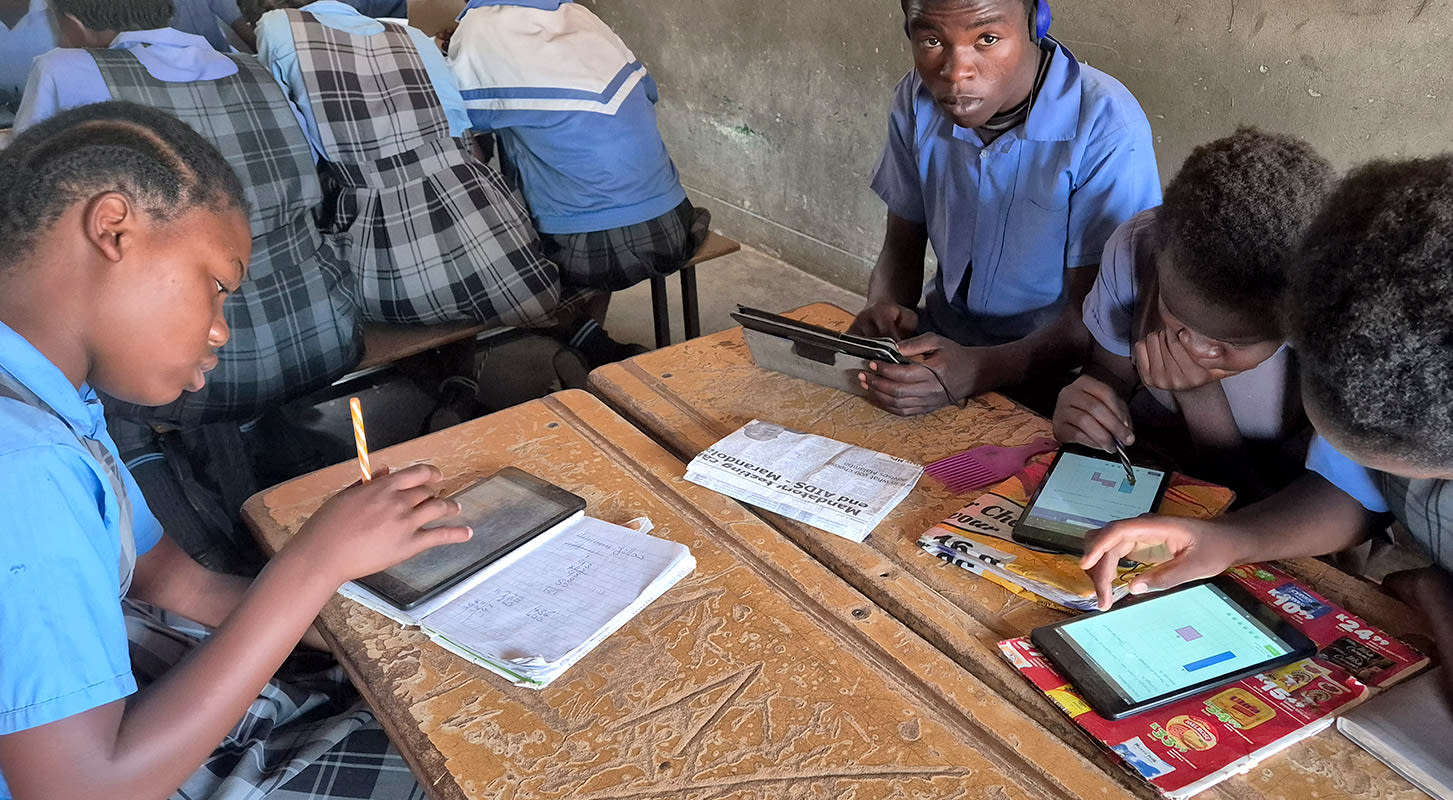
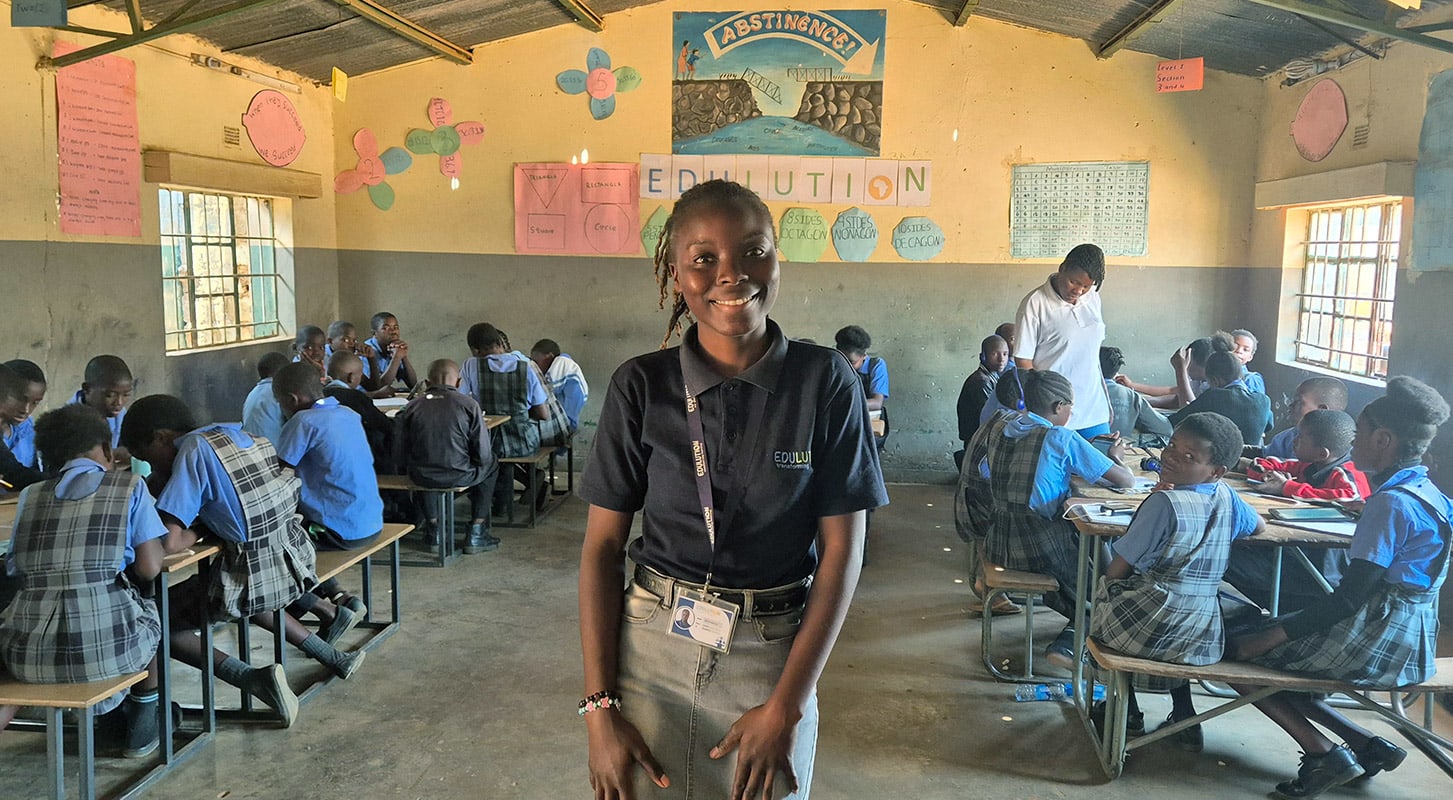
Edulution uses a turnkey solution that involves robust hardware in the form of tablets, charging stations and solar power, managed by coaches recruited from the local community. Each learner has their own tablet and follows a digital curriculum carefully designed to allow them to work at their own pace.
APPROACH
Monitoring key outcomes
It’s a process that works – Edulution is 32% more successful than traditional schooling. And as a system that relies on digital technology, the data it produces is a core contributor to its success.
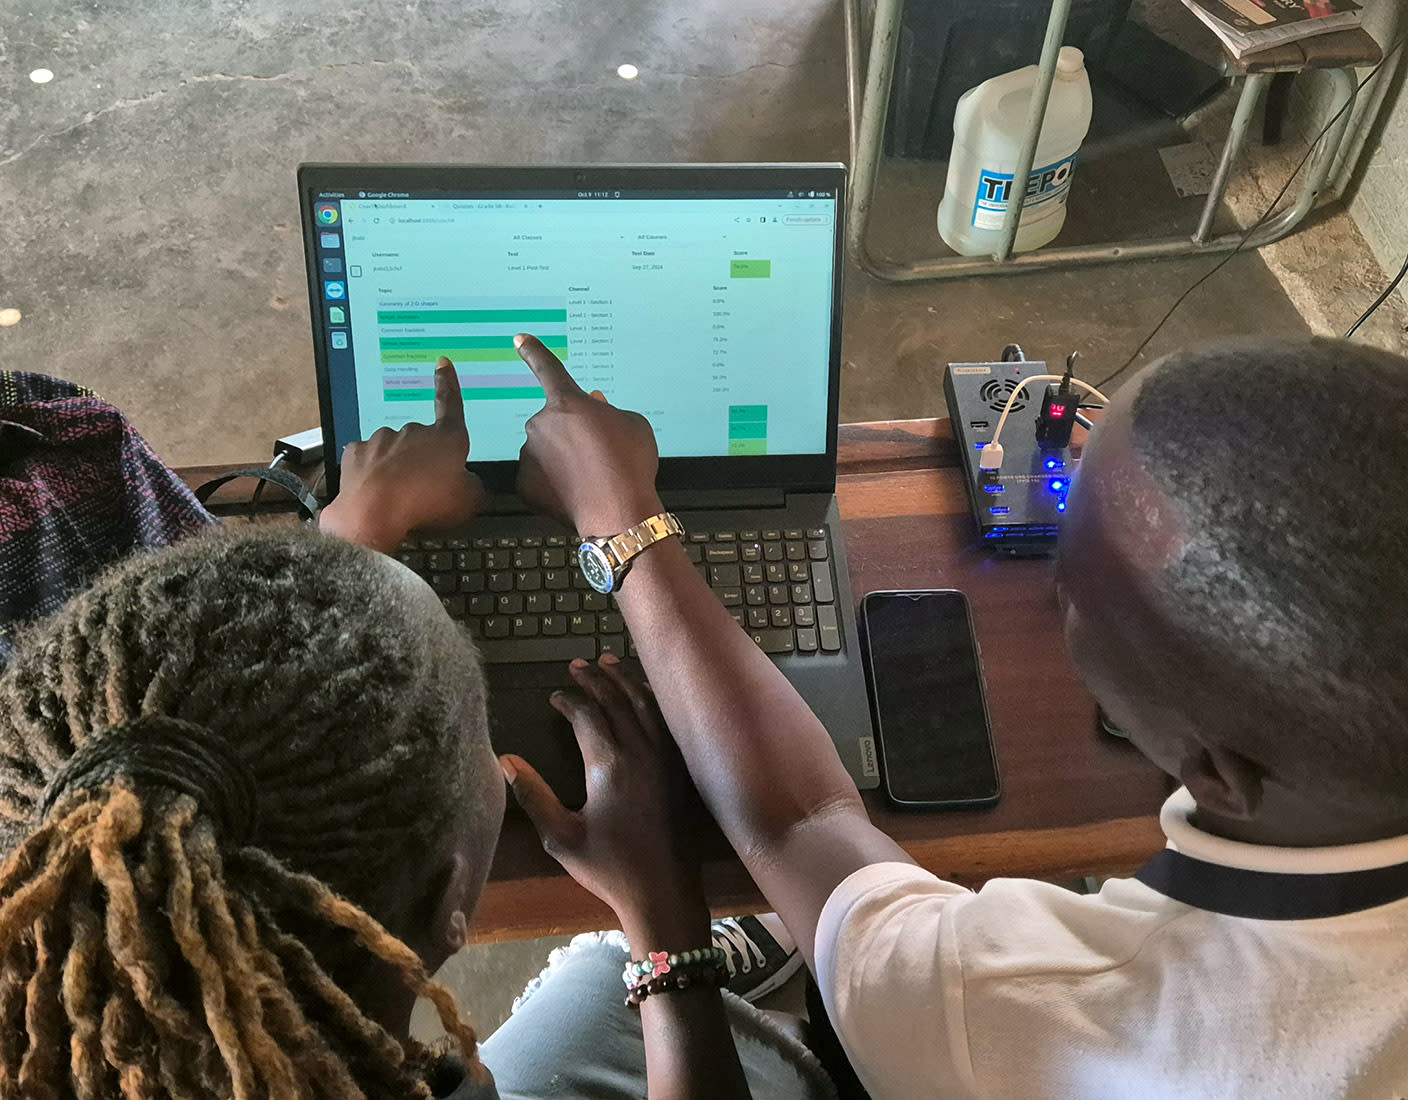
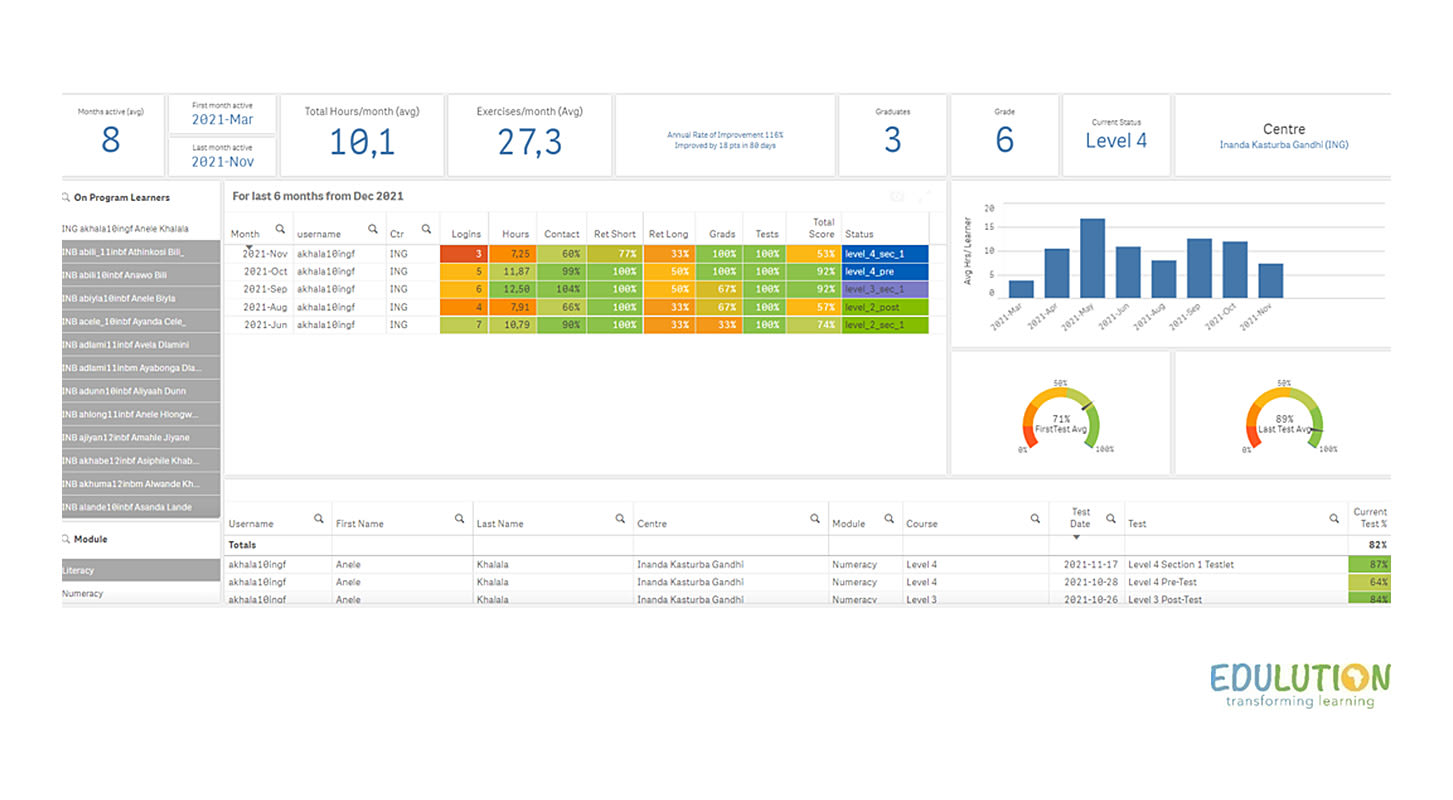
Learner activity and assessment data is sent monthly over a low-bandwidth connection to a central database for processing. Qlik Cloud Analytics then segments, analyzes and presents the data to meet a variety of use cases – from tracking the performance of each child to higher-level overviews of key management indicators.
RESULTS
Critical levels of insight and transparency
At the learning center level, the analysis that Edulution produces with Qlik allows coaches to track the progress made by each learner and tailor each session accordingly. Children who complete a topic successfully can move on to the next; critically, those who don’t are given extra time, materials and support.
Qlik dashboards and analytics then work up through Edulution’s organization, tracking key performance indicators (KPIs) for each center and providing a broader, more holistic overview of Edulution’s progress, successes and opportunities to improve.
WHAT THIS MEANS FOR YOU
Changing perspectives for learning
For Edulution, high-quality data, analytics and visuals are critical to how it monitors progress, improves outcomes and provides invaluable feedback to key stakeholders – including its funders.
The most important outcome, however, is that to date around 60,000 children across South Africa and Zambia have been able to access an innovative teaching system – and a highly talented and motivated network of coaches – that leverage the indicators and insights enabled by Qlik to respond to learners’ needs and transform their perspectives of education.
Qlik shows us which tests a child has done, how far they’ve progressed, how many times they’ve logged in and how many hours they’ve spent. It’s exactly the information we need.