Business Dashboard

Examples, benefits, and best practices. This guide provides practical advice to help you create world-class business dashboards

What is a Business Dashboard?

A business dashboard is an interactive data visualization and analysis tool, enabling the presentation, monitoring, and examination of key performance indicators (KPIs) and metrics. Modern dashboards integrate real-time data from diverse sources and facilitate AI-supported data preparation, analysis, and chart generation, transforming raw data into valuable insights that enhance business performance.

5 Main Types

Here we describe five key types of business dashboard templates, each serving a unique purpose and different level of management. 

1. Simple Web Analytics

  • Focus: Short-term goals and objectives.

  • Purpose: Similar to a Google Analytics dashboard, a simple analytics dashboard usually includes information such as traffic sources, page views and sessions, bounce rate, conversion rate, user behavior, demographic and geographic data, and goal completions.

    Web analytics dashboards highlight metrics such bounce rate in real time to understand performance.

    Explore a Simple Web Analytics Dashboard

2. Sophisticated Web Analytics

  • Focus: Long-term goals and objectives.

  • Purpose: This dashboard, accessible within a contemporary data analytics or business intelligence (BI) platform, consolidates information from various systems such as social media, CRM, and even spreadsheets to enable the integration of marketing campaigns with revenue outcomes. It assists in refining your digital marketing budget and strategies, such as Google Ads and SEO, by aligning them with factors directly influencing revenue, rather than merely tracking website activity. 

    Screenshot of a Qlik Sense campaign analytics dashboard

    More Sophisticated Web Analytics Dashboards

3. Operational Dashboards

  • Focus: Day-to-day operations.

  • Purpose: Offer instant updates on crucial metrics and key performance indicators (KPIs), facilitating prompt actions and decisions concerning operational activities. These graphs are commonly utilized by front-line staff and managers to oversee continuous processes and tasks.

    Screenshot of an Operational Dashboard for a manufacturing plant operations

    This dashboard identifies operational efficiencies by visually representing the specifics of business operations and comparing actual performance with standards for key performance indicators (KPIs).

    Explore Operational Dashboards

4. Strategic Dashboards

  • Focus: Long-term goals and objectives.

  • Purpose: Conform to the overarching strategic goals of a business or organization. These dashboards spotlight elevated key performance indicators (KPIs) crucial for assessing advancement towards long-term objectives and the overall health of the business. They are commonly employed by top-level executives and decision-makers.

    Screenshot of Strategic Dashboard for ratio analysis

    This dashboard helps your CFO and other executives track key leverage ratios such as debt-to-equity (D/E) and better understand your company's risk profile and ability to service its debt obligations.

    Explore a Strategic Dashboard
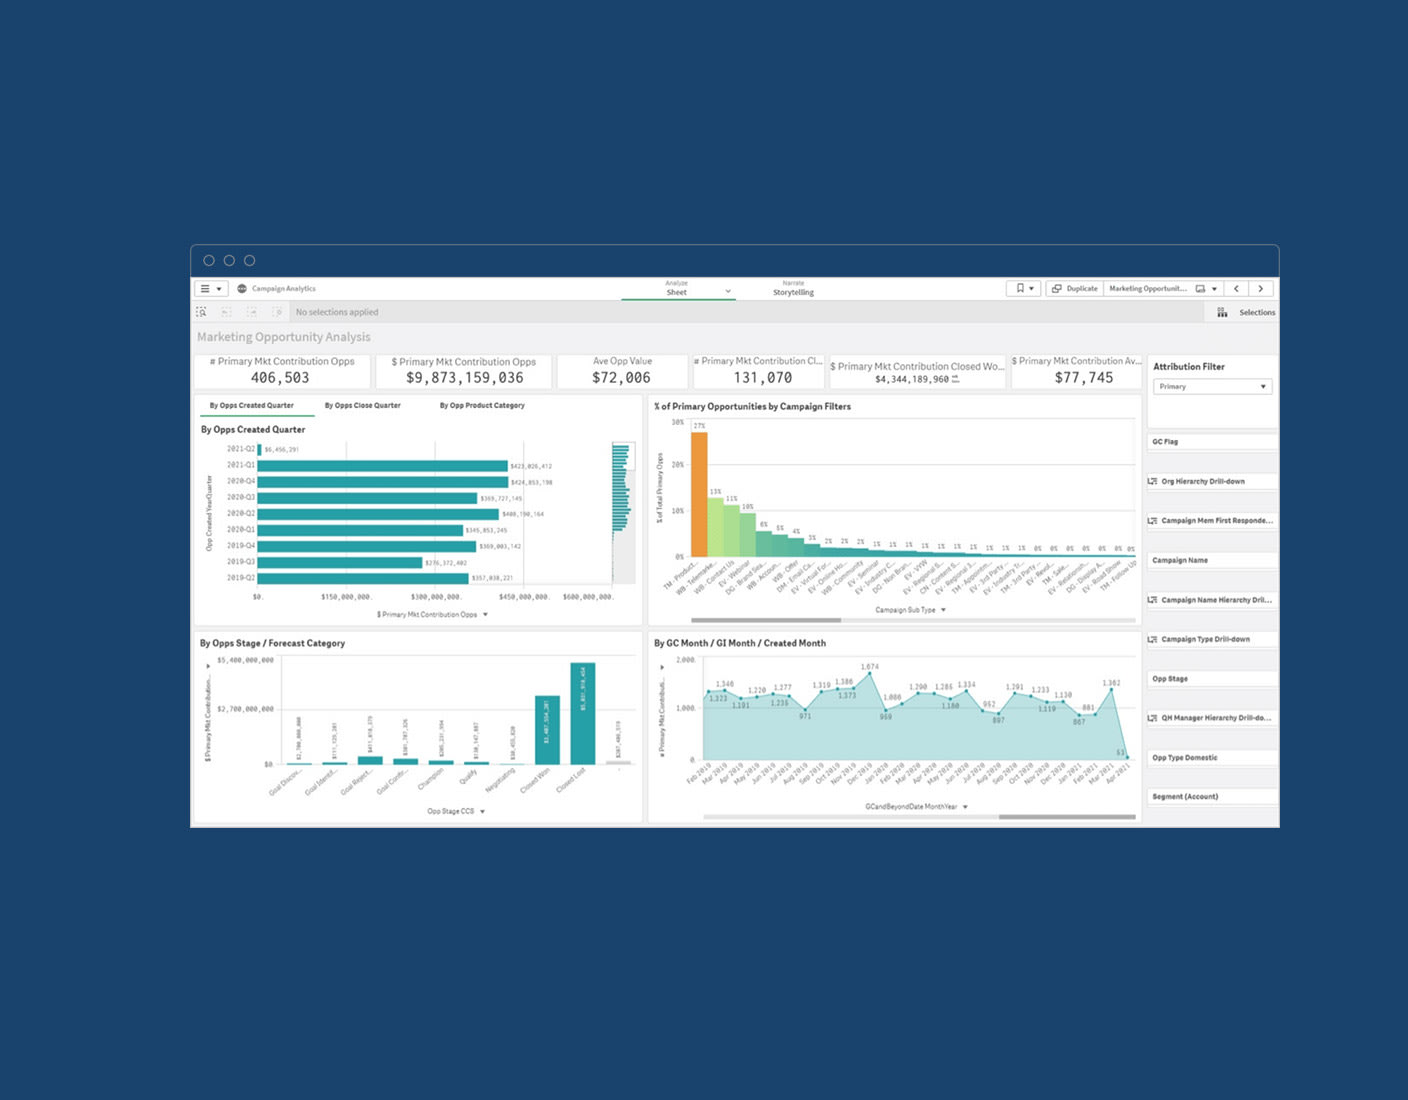
5. Tactical Dashboards

  • Focus: Mid-term decision-making and planning.

  • Purpose: Bridge the divide between operational and strategic dashboards by providing insights conducive to mid-term decision-making, frequently associated with specific projects, initiatives, or departments. Tactical dashboards contribute to monitoring advancements toward more immediate objectives.

    Screenshot of a Tactical Dashboard for campaign analytics

    This dashboard lets your marketing team know how their efforts impact pipeline creation and revenue using accurate campaign attribution.

    More Marketing Dashboards

How to Design Best-in-Class Dashboards - Image

How to Design Best-in-Class Dashboards

Download our ebook with 4 must-see dashboard examples.

Benefits

In essence, dashboard software converts Google Analytics data and other unprocessed datasets into actionable insights, ultimately guiding more informed decision-making and enhancing business outcomes. Here are four fundamental advantages of a modern, well-crafted dashboard.

Better Decision-Making

  • Spotting Trends and Patterns: BI dashboards assist stakeholders in identifying opportunities, threats, and potential areas for improvement by showcasing data trends and patterns.

  • Streamlining Complex Data: Visualizations on dashboards present intricate data in a clear and understandable manner, simplifying the comprehension of complex information.

  • Promoting Communication: Dashboards' visual nature eases the sharing of data-driven insights across teams, facilitating seamless communication.

Real-time Insights

Leading tools have the capability to retrieve live data, allowing for real-time monitoring and data analysis of crucial performance metrics. This prompt information facilitates swift responses to dynamic situations and contributes to staying proactive in anticipating trends.

More Collaboration

Dashboards foster teamwork and collaboration by offering a shared platform for viewing and discussing data, enabling teams to collaborate towards shared objectives and align their efforts based on the insights provided by the dashboard.

Improved Data Accessibility

Analytical dashboards consolidate data from diverse sources, presenting a unified and readily accessible perspective. This negates the necessity for manual data collection and analysis, thereby saving time and ensuring precision.

How to Create a Business Dashboard

Following best practices helps guarantee the effectiveness of your business analytics dashboard, making it user-friendly and capable of providing valuable insights to facilitate informed decision-making. Here are some recommended practices to keep in mind as you develop your own.

Set Your Objectives

  • It is essential to precisely outline the purpose and objectives of your dashboard, including identifying the intended audience and the specific questions it should address. This guarantees that the dashboard concentrates on providing pertinent insights in alignment with the overarching objectives of your business.

Choose Your KPIs (Key Performance Indicators)

  • Thoughtfully choosing the most relevant KPIs is crucial, as these metrics should accurately represent the performance and advancement towards the established objectives. Opting for the appropriate KPIs ensures that the dashboard yields insightful information.

Integrate and Clean Your Data

  • Look beyond Google Analytics, identify the necessary data sources, and determine its location. Then, aggregate this data from diverse sources to obtain a comprehensive view. This integration process guarantees that the dashboard encompasses all pertinent information required for thorough analysis.

  • Clean data ensures accurate and reliable insights. So, your data should be cleaned and standardized to remove inconsistencies, errors, or duplicates. 

Use Visualization Best Practices

  • Ensure your visualizations are clear, concise, and easily understandable. 

  • Prevent clutter and select suitable visualization types for different data sets. 

  • Integrate interactive elements where relevant, enabling users to delve into data and acquire deeper insights. 

  • Sustain a uniform style and color scheme across the dashboard to provide a cohesive and user-friendly experience. 

Dashboard Design Guide

10 Ways to Take Your Visualizations to the Next Level

Inspire action with your data. Learn about the latest visualizations and how to choose the right ones to highlight the most important aspects of your data.

Analyst Perspectives

Qlik Sense earned 6 number one KPI rankings including Business Value and Analyses, and 45 leadership positions.

89% of surveyed users rated Qlik Sense Dashboard functionality as excellent or good.

Cheers to 13 years!

Qlik has been named a Leader in the Gartner® Magic Quadrant™ for Analytics and Business Intelligence Platforms for the 13th year in a row.

See Interactive Dashboards in Action