


The Tour de Qlik just completed its 10th stage at the AWS re:Invent conference in Las Vegas from Dec 1-4, 2025. With this being our biggest event to date, we thought it a good time to reflect on the Tour de Qlik project, and lift the lid on this amazing concept to share some details about what kind of data and analytics we’ve generated.
For AWS re:Invent, Tour de Qlik leveraged the existing streaming data ingestion architecture, built on AWS, powered by the Qlik Open Lakehouse, to capture IoT streaming events via Amazon Kinesis into optimized Iceberg tables for near real time analytics. On top of this architecture, we also added two additional Qlik capabilities, making the most of the Qlik services available.

Highlights of the technical architecture include:
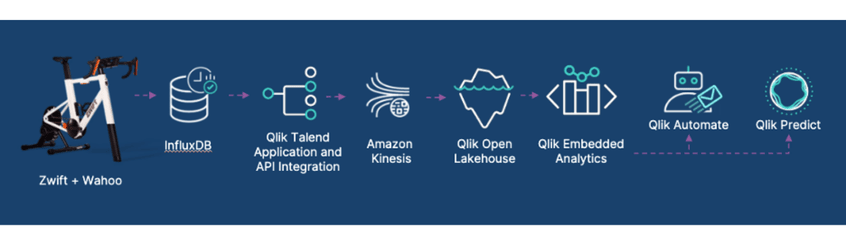
Talend Application and API Integration reads sensor events from a local Influx DB instance and writes those events to AWS Kinesis. Note we decided to use a local persistence store, such as Influx, to avoid any latency issues experienced with event Wi-Fi and networking.
Qlik Talend Cloud then ingested those events from AWS Kinesis into optimized Apache Iceberg tables via our recently announced streaming data ingestion capability of the Qlik Open Lakehouse.
Qlik Analytics then provided a rich leaderboard through its embedded capabilities that provided riders with an intuitive way to analyze their performance, including tracking their power, cadence, and speed over the duration of their race, as well as comparing their performance to that of other riders.
Within Qlik Analytics, Qlik Automate was used to act on riders' data in real time, both in the sending of key metrics via e-mail right after they hopped off the bike, as well as real time notifications if they were knocked off their top position on the leaderboard.
Qlik Predict was used to allow riders to generate “what if” type scenarios. Leveraging predictive analytics to show what the impact on their ride time would be if they were able to generate more or less power, and a greater or lesser cadence.
This architecture provided attendees with a real-world implementation of an end-to-end data integration and analytics use case, leveraging a real time streaming data source where the riders themselves acted as data generators.
Tour de Qlik at AWS re:Invent saw our highest ever ridership, with 470 unique riders completing 508 rides. Riders came from 48 unique countries, from 6 different continents!

Across all rides, this saw AWS re:Invent attendees cycle a total of 252.5 miles (406.4km), the approximate distance between Las Vegas, NV and Los Angeles, CA (or London to Paris)!
All the rides that took place during AWS re:Invent generated a total of 2.84 million sensor events that were streamed from the bikes to Influx DB and then on to AWS Kinesis.

As with any real time ingestion into Apache Iceberg, this table would have suffered from the “Small File Problem”, with over 1200 small parquet files making up the table. This would have required each query run against the table to open and close 1200 files, impacting performance just to read a relatively small amount of data. Fortunately, the Qlik Open Lakehouse runs the Adaptive Optimizer in the background, which automated the execution of 179 compaction processes over the course of AWS re:Invent, keeping the number of files needing to be opened in the 1-4 range, resulting in consistently optimal performance.
In addition to file compaction, the Qlik Adaptive Optimizer ran continuous snapshot expiration procedures, expiring 2089 snapshots, which allowed 1148 unneeded data files to be deleted, reclaiming 326mb of storage. For a table that was only 3.58mb in size, this accounts for a 90% reduction in storage.
While I acknowledge that these data volumes seem trivial, it gets the point across. In a real world IoT use case, instead of two bikes, you’d have thousands of sensors generating far greater data volumes. The benefits of the Qlik Adaptive Optimizer would scale linearly, allowing you to keep your file counts manageable for performance, and reclaim a significant amount of storage via efficient file cleanups.
Since the sensor data was ingested into Iceberg tables in real time, Qlik Analytics was able to provide riders with a real time review of their performance. Check out the interactive leaderboard!
Users were able to view the power, speed, and cadence over the duration of their sprint and also compare their performance to that of their peers. In the background, Qlik Automate ran over 1000 automations, providing riders with emails of their results, and real time alerts if they were knocked off their position on the leaderboard.
This created a buzz and some really deep data driven conversations. It was a fun way to show folks just how Qlik can Do Data Differently and I am proud to be part of the team that brought this to life.