


Sports
Doing Cycling Differently with Q36.5 Pro Cycling Team at Qlik Connect


Need more cowbells.
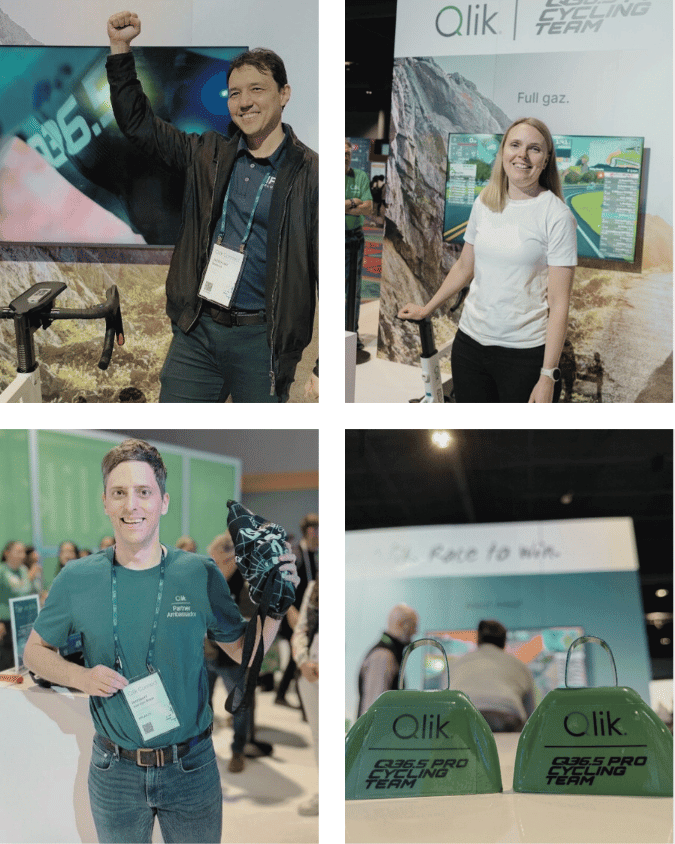
If you heard the sound of cowbells echoing across the Qlik Connect show floor, you weren’t imagining things. That was the rallying cry of the first-ever Tour de Qlik—a high-energy activity based on our sponsorship with Q36.5 Pro Cycling Team, Qlik’s official pro cycling partner, and a celebration of data-powered performance.
With every pedal stroke, attendees weren’t just racing each other—they were helping raise awareness and riding for smiles by supporting Special Olympics. And thanks to Qlik, the action wasn’t just physical—it was real-time, visual, and fully data-driven.
It was a privilege to work with a smart bunch of Qlikkies, across the business, who united as a team and worked tirelessly to create the force that became ‘Tour de Qlik’, all using our own tech to create an end-to-end solution.
It started with a crazy idea of using Zwift, a virtual training platform, to set up a fun challenge where Qlik attendees could compete against each other. However, instead of handwriting results on a whiteboard (like you see in some events), being Qlik we’re not content with doing data in such a manual way, so we cranked it up to 11 and did data differently.
You see Zwift have their own smart training bikes that transmit data via Bluetooth and ANT+ protocols. The Zwift platform uses this data in their virtual environment so you can join other cyclists across the world and ride on various courses. ANT+ is an open protocol from Garmin and delivers 40 data points a second, for over 15 different metrics. We collected these data points, combined with other data sources, to generate a leaderboard in Qlik Cloud Analytics focused on speed, cadence and power.
A Leaderboard Built for Speed
On-site riders powered through their sessions with one eye on a virtual Zwift course, and the other on the real-time leaderboard, updated live using:
Qlik Talend Application and API Integration - moved the bike data from a local timeseries database, into the cloud.
Qlik Talend Cloud - transformed the data and created an Open Lakehouse cluster in Apache Iceberg format on AWS S3 using our newly announced Qlik Open Lakehouse.
Qlik Cloud Analytics - Qlik Embedded Analytics combined all this data for the leaderboard, as a mashup. Showcasing Qlik’s beautiful design capabilities, as well as our unique Analytics Engine to deliver real-time insights.
All built on AWS S3 infrastructure
Every ride was tracked, streamed, and visualized as it happened, creating a dynamic experience that brought data, sport, and impact together in one view. Whether it was your first spin or your fifth, you could instantly see where you ranked—and how your efforts were stacking up.
You can view the results here: Tour de Qlik Leaderboard app
Driven by Data. Fueled by Passion.
In professional cycling, data isn't just a nice-to-have—it's a critical advantage. Every watt, heartbeat, cadence, and incline are analyzed for marginal gains. In a sport where a one-second improvement can mean a podium finish or the back of the pack, data delivers clarity, direction, and strategy.
That’s exactly why Q36.5 Pro Cycling Team see’s Qlik as their 26th member of the team. And it’s why we brought the spirit of data-driven competition right to the heart of Qlik Connect.
The Results Are In
Congratulations to everyone who took part in the Tour de Qlik—and a huge thank-you to the Q36.5 Pro Cycling Team for inspiring us all.
At the end of the event, we held two race offs between the Top Three male and female riders on the leaderboard. The winners of each of these races won an exclusive Qlik branded Q36.5 Pro Cycling gear.
We also raffled off one of the Zwift bikes with a Wahoo smart trainer for one of the lucky riders who was picked at random. And the winners were ….
Winners: Jefferson Shibuya, IPC Global (raffle winner of the Zwift & Wahoo trainer bike); Heidi Engelstad, twoday AS (Top 3 Ladies race off); Lennaert van den Brink, E-mergo (Top 3 Men’s race off)
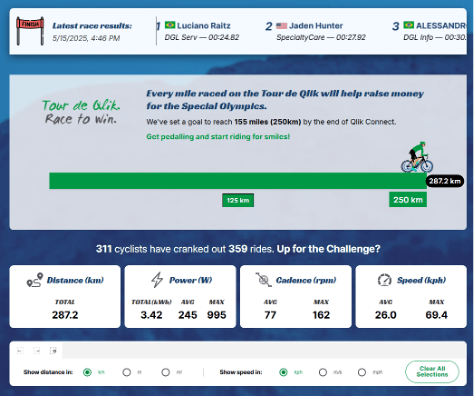
Total riders completed: 311 cyclists cranked out 359 rides.
Miles ridden for Special Olympics: 178.5 miles (almost 290km) raising $7500 USD
Illuminating Fact: The total watts generated by our riders would of kept a 100w lightbulb burning bright for the entire duration of Qlik Connect
Every spin, sprint, and session counted.
More Than a Ride
The Tour de Qlik at Qlik Connect wasn’t just about fun—it was about showcasing the power of connected data, performance, and purpose. Whether you're chasing medals or margins, it’s clear: when you combine world-class athletes with a world-class analytics platform, you get something truly special.
So yes—we’ll definitely need more cowbells next year. (Lots of them!)
In this article:
Sports