What it is, why it matters, and techniques. This guide provides definitions and practical advice to help you understand and execute financial analysis.
Financial analysis is the process of examining financial statements and other relevant data to assess the financial health and performance of an organization. This analysis typically involves reviewing a company's income statement, balance sheet, and cash flow statement to assess its profitability, liquidity, solvency, and overall financial position. Using the right tools and techniques to analyze your data can help you make informed investment or business decisions and gain insights that allow you to predict and improve performance.
Financial Statement Analysis
There is a wide range of techniques used in financial planning and analysis. First we’ll cover the 3 key financial statements and horizontal analysis. Modern financial analytics tools make it easy for anyone to create their own dashboards. Click any of the interactive dashboards below to explore.
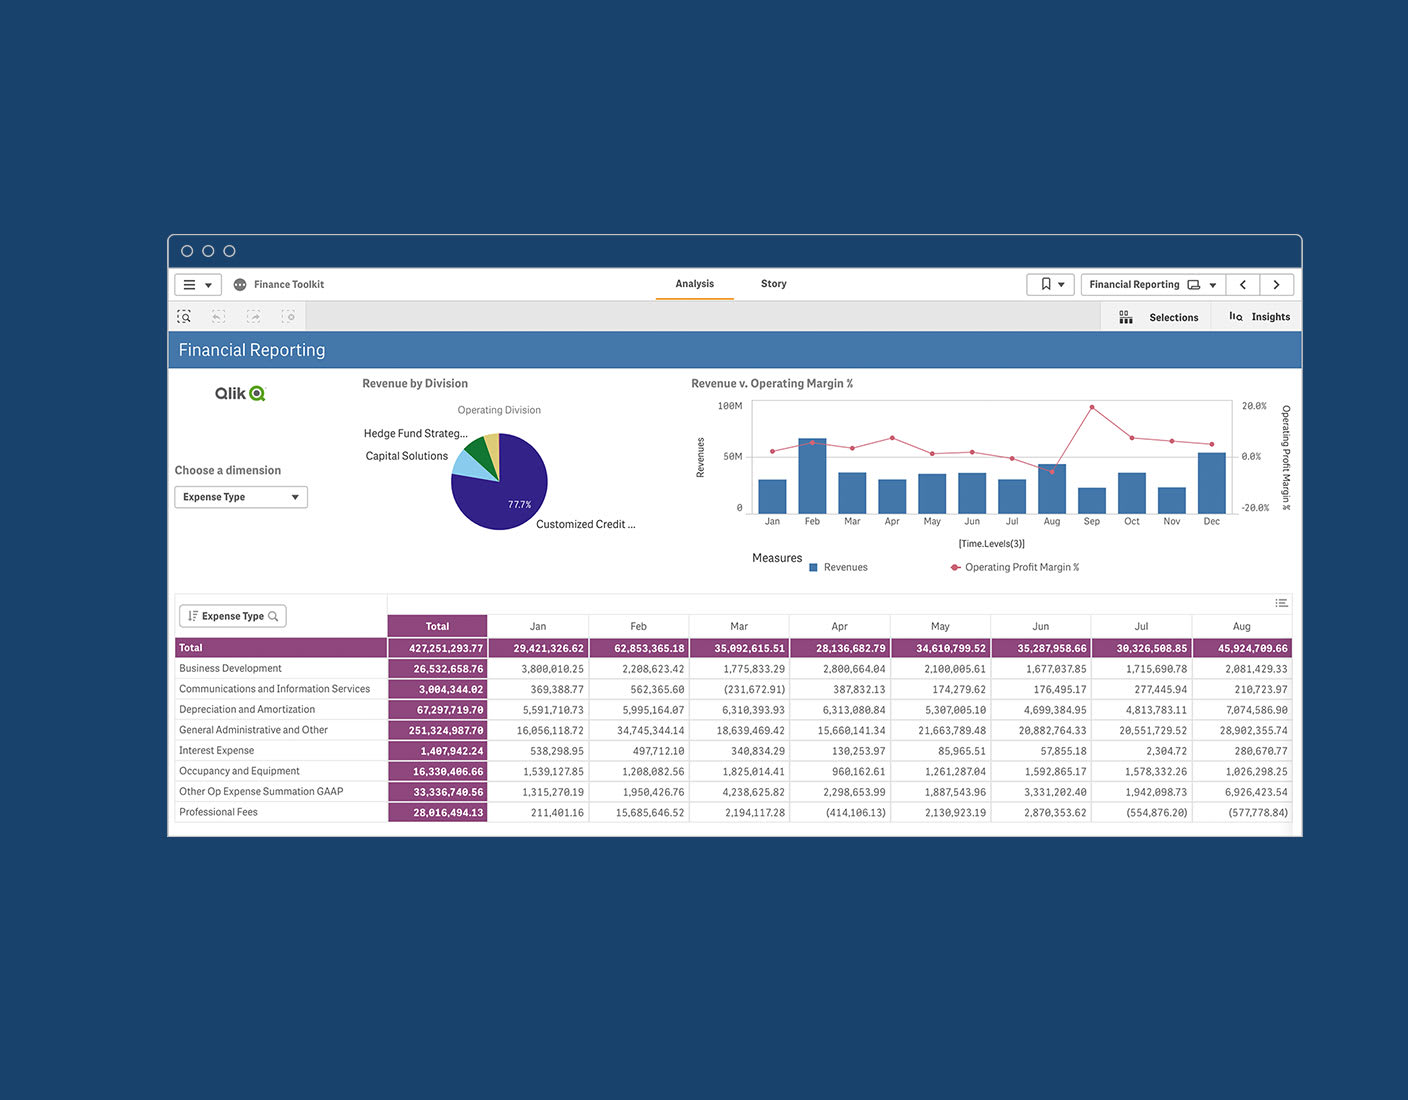
Income Statement
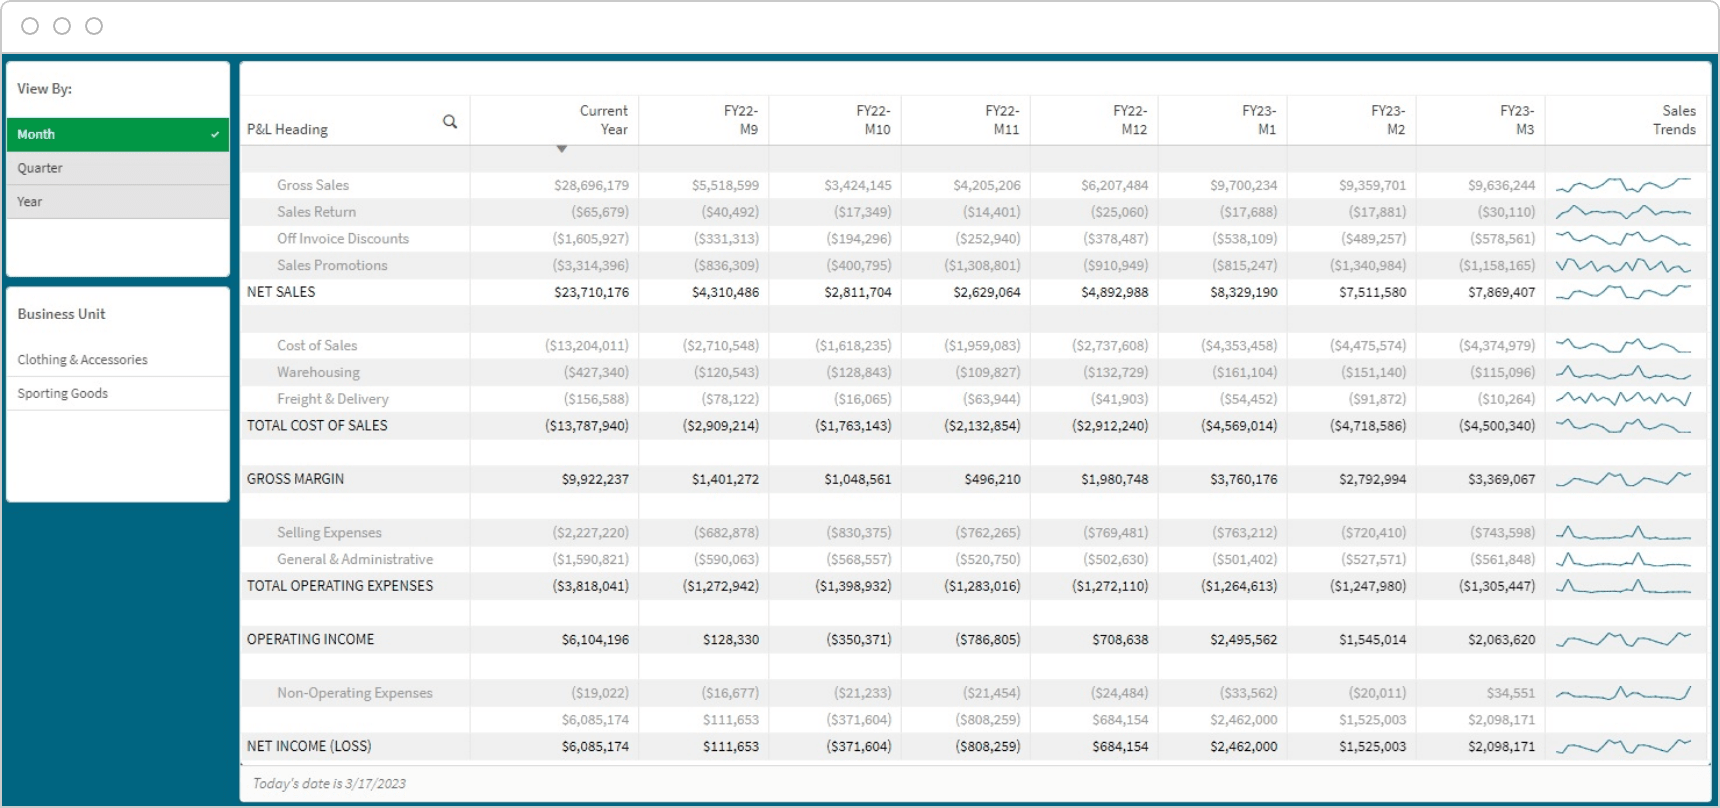
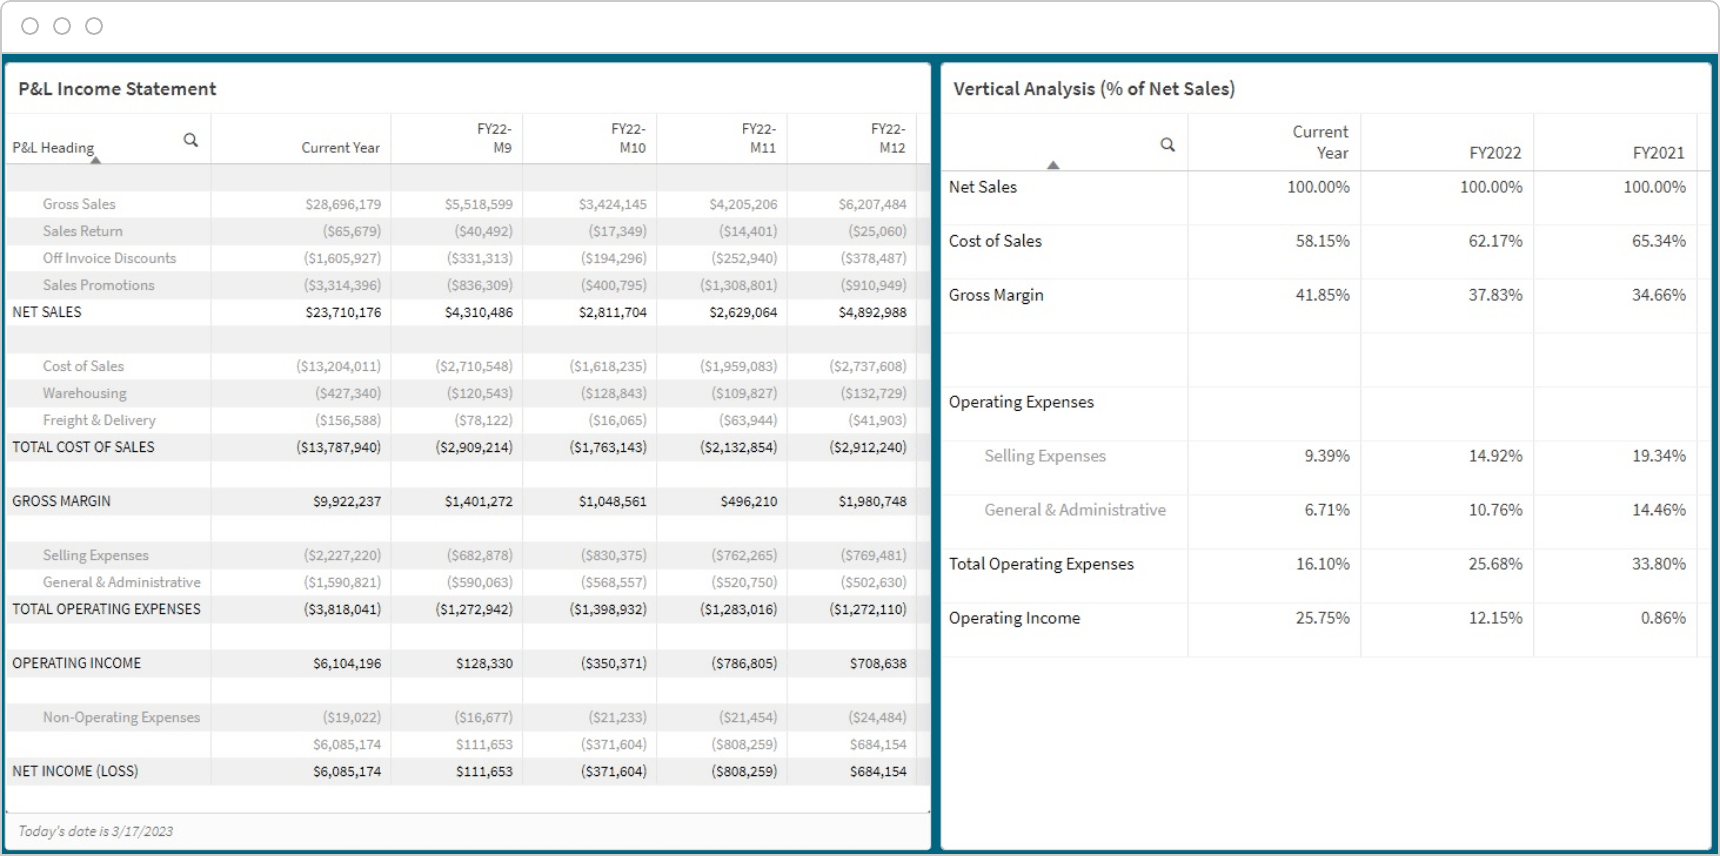
The income statement (or P&L statement) shows your company's revenues and expenses over a period of time and calculates the net income or loss. It provides information about your company's profitability and is used to assess its ability to generate profits from its operations.
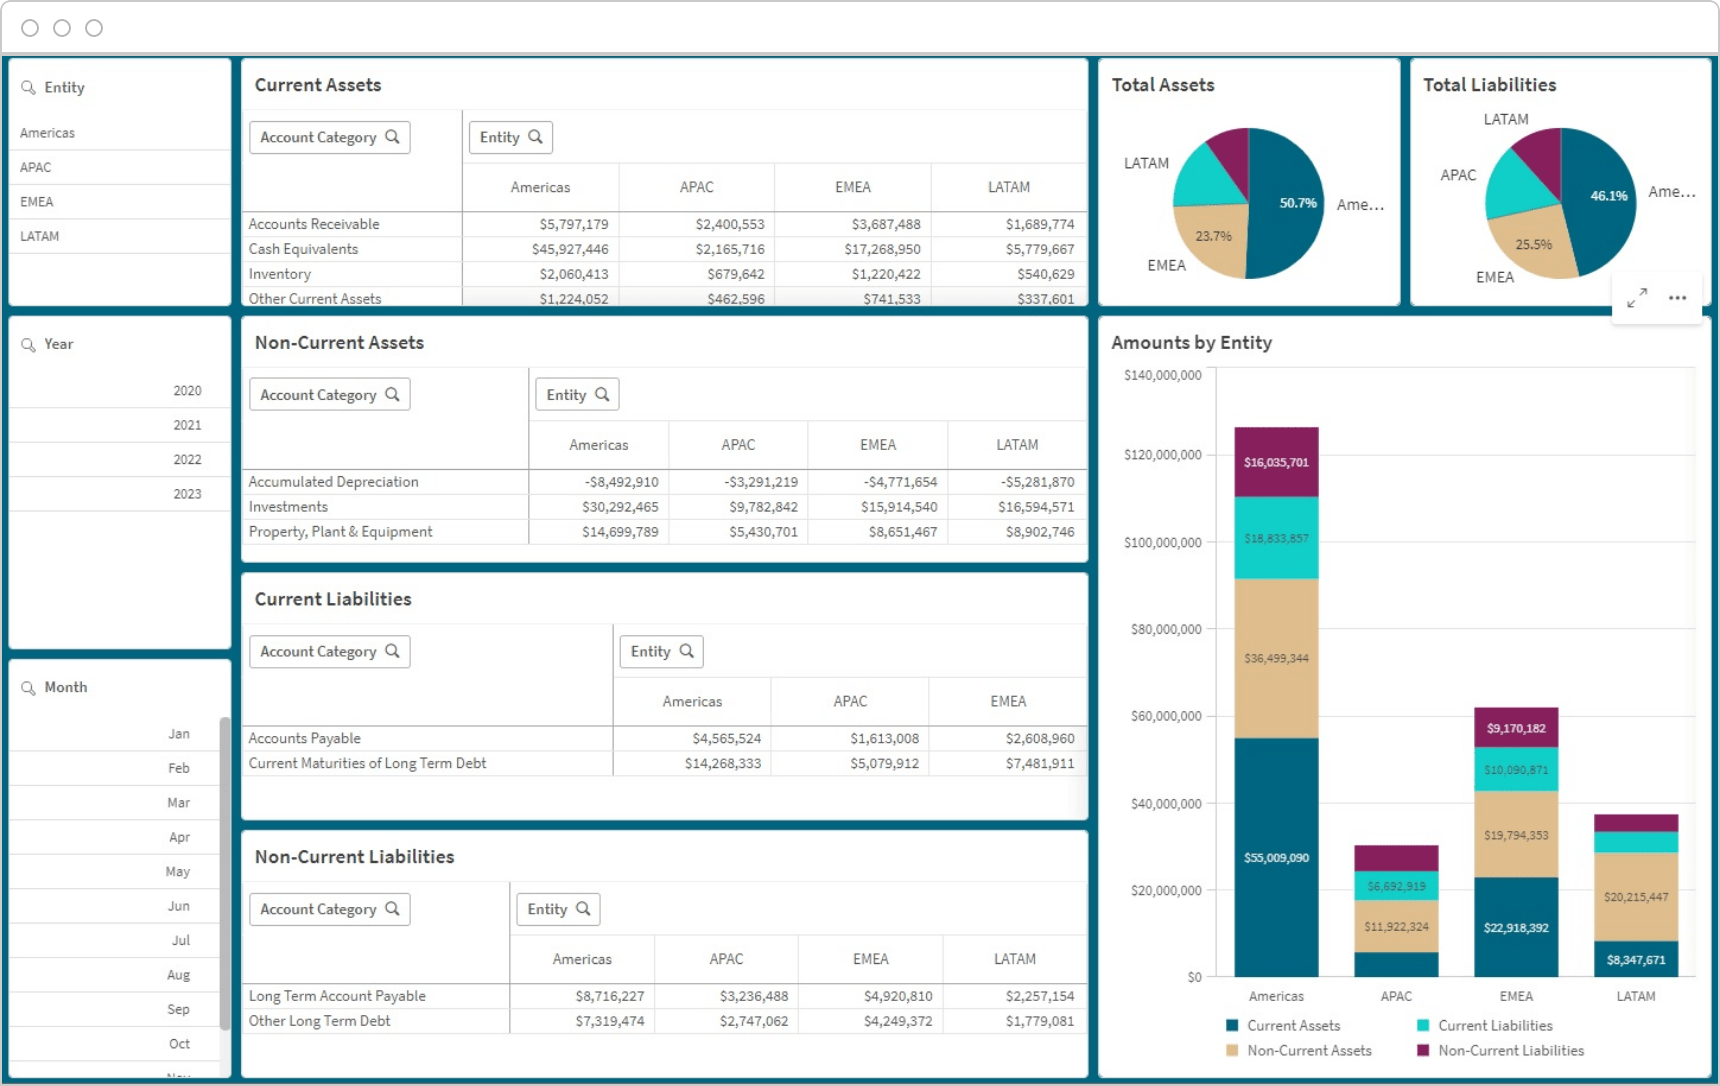
The balance sheet shows your company’s assets, liabilities, and equity at a specific point in time. It provides information about your company’s liquidity and solvency, as well as its ability to meet its financial obligations.
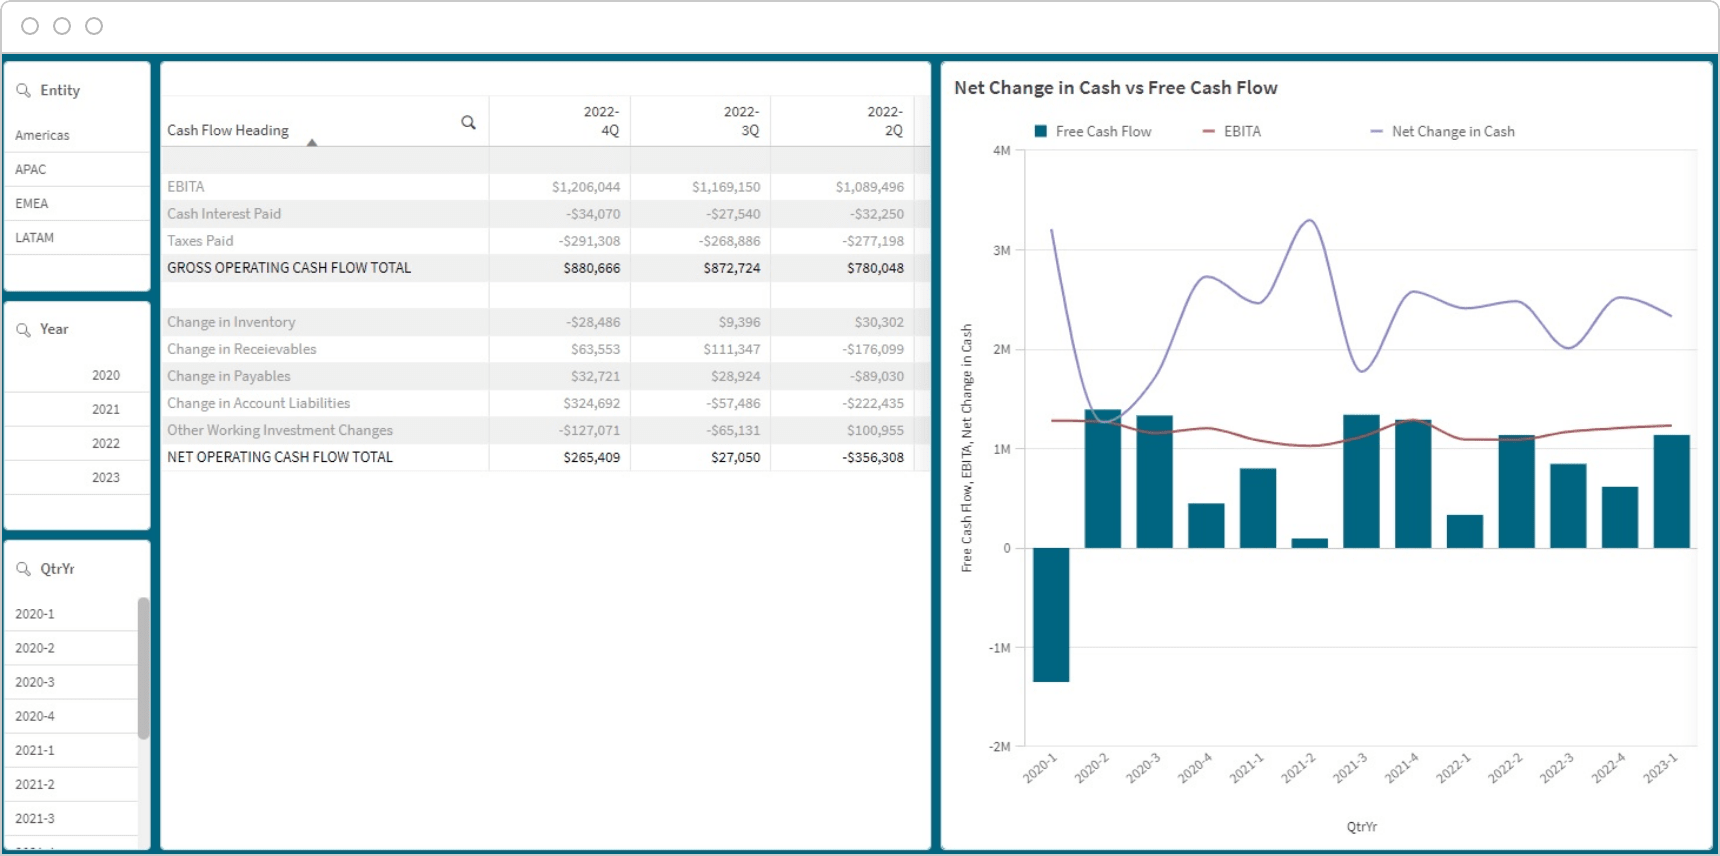
The cash flow statement shows your company’s cash inflows and outflows over a period of time. It provides information about your company’s ability to generate cash and manage its cash flow.
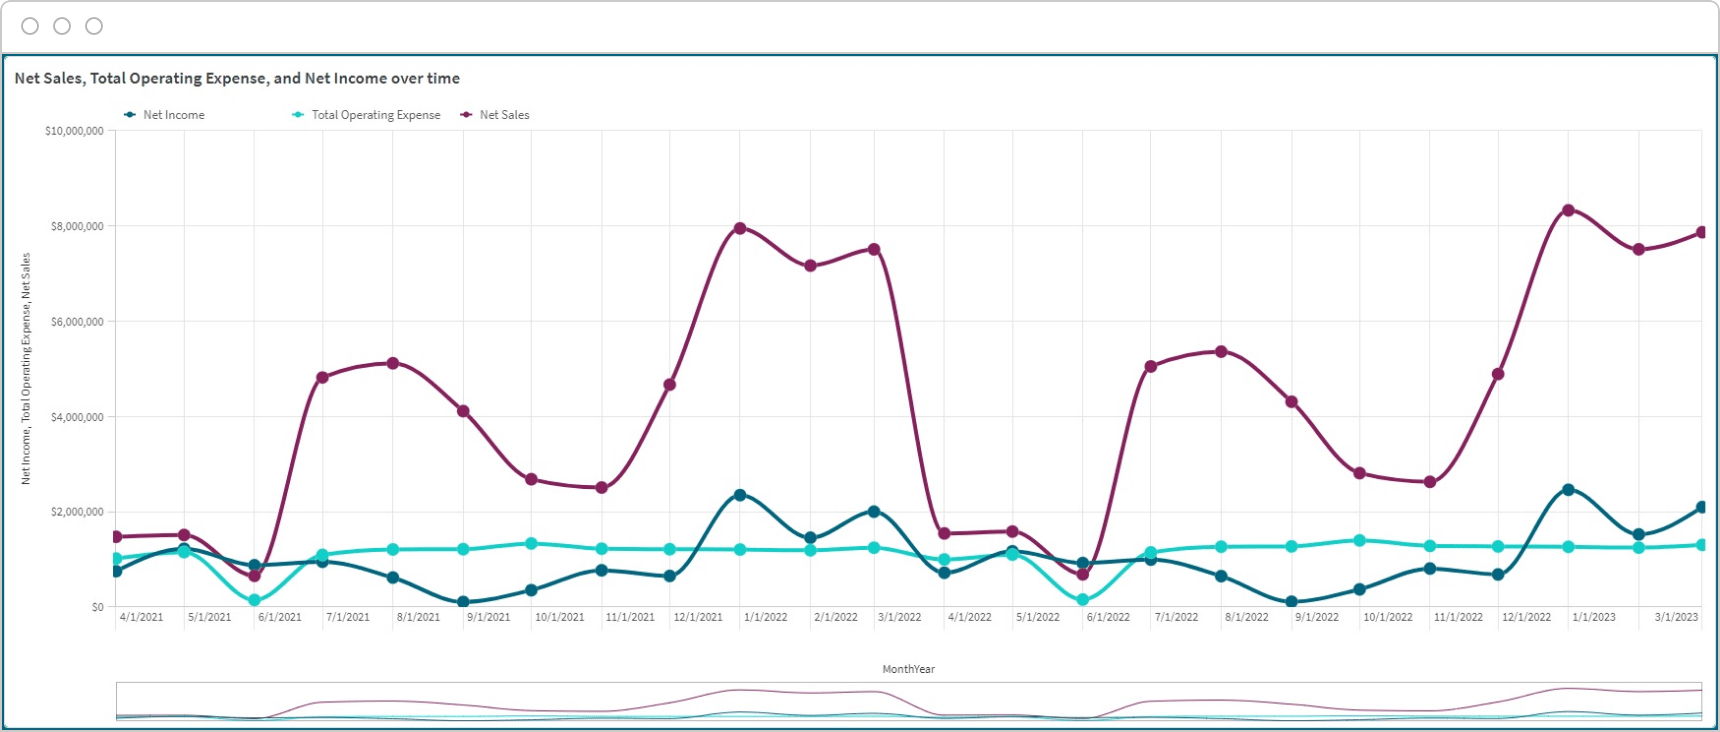
Horizontal analysis involves comparing your company’s financial performance over time. Analyzing changes in key financial metrics such as revenue, expenses, and net income, helps you gain insights into your company’s financial health, growth potential, and overall performance.
Financial ratio analysis involves interpretation and analysis of the income statement, balance sheet, and cash flow statement. Ratios are calculated by dividing one financial statement item by another. Here are the top 15 techniques:
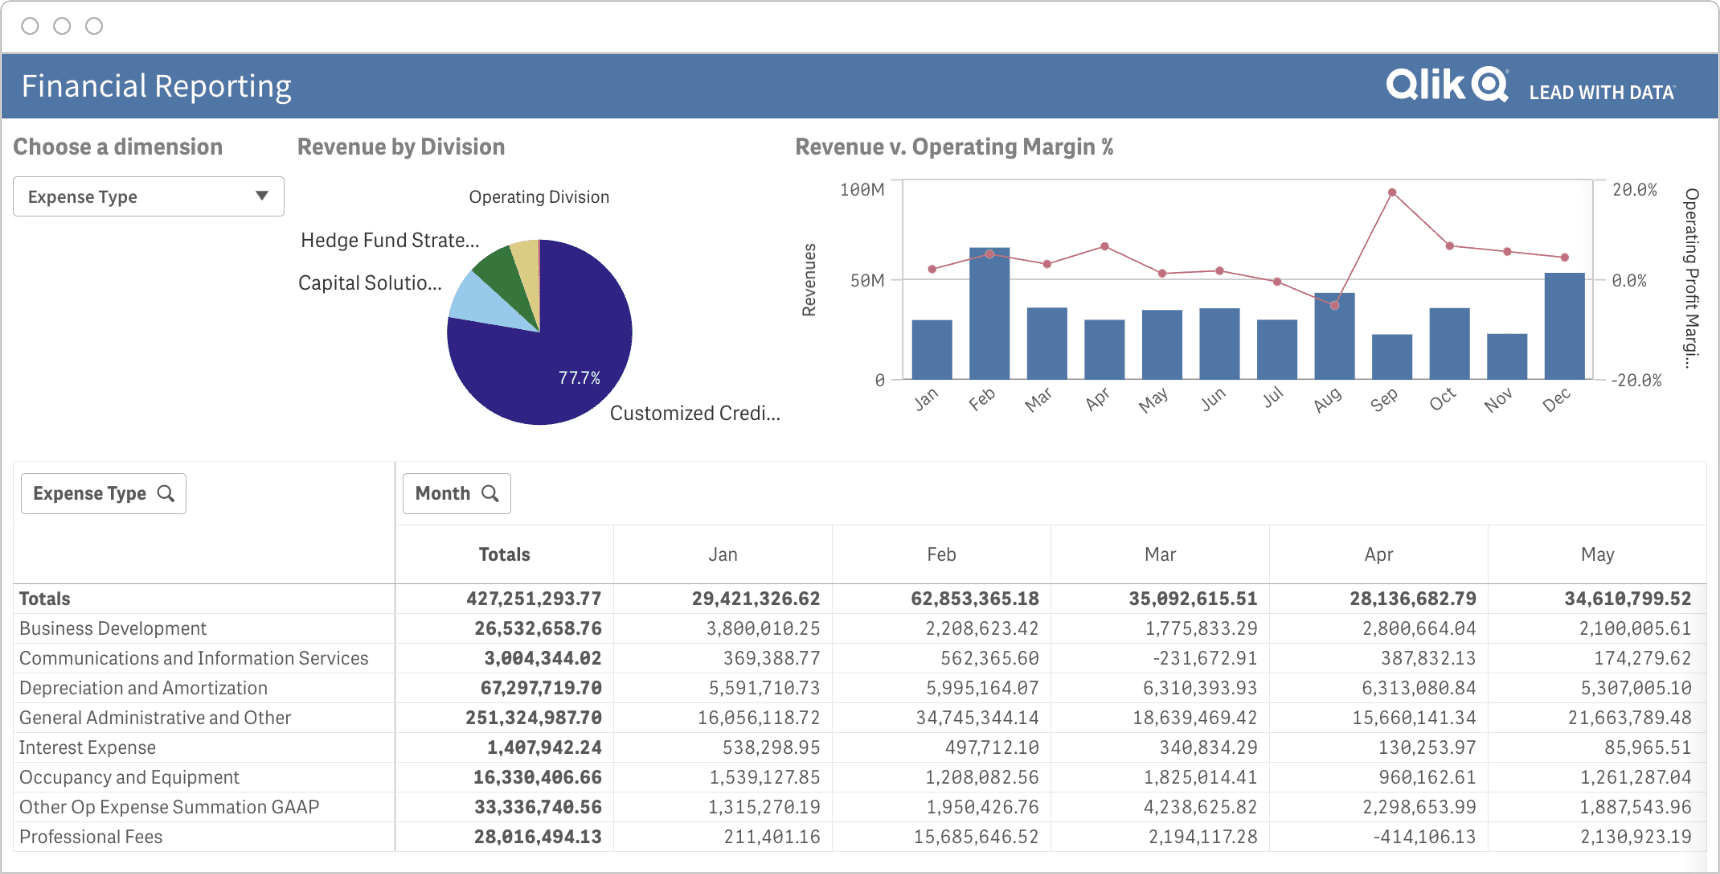
Vertical Analysis
Vertical analysis involves calculating the proportion of each item on your company’s financial statement to a base figure, usually sales revenue or total assets. The purpose here is to determine the relative weight of each item and to identify any trends or changes that may affect your company’s financial health.
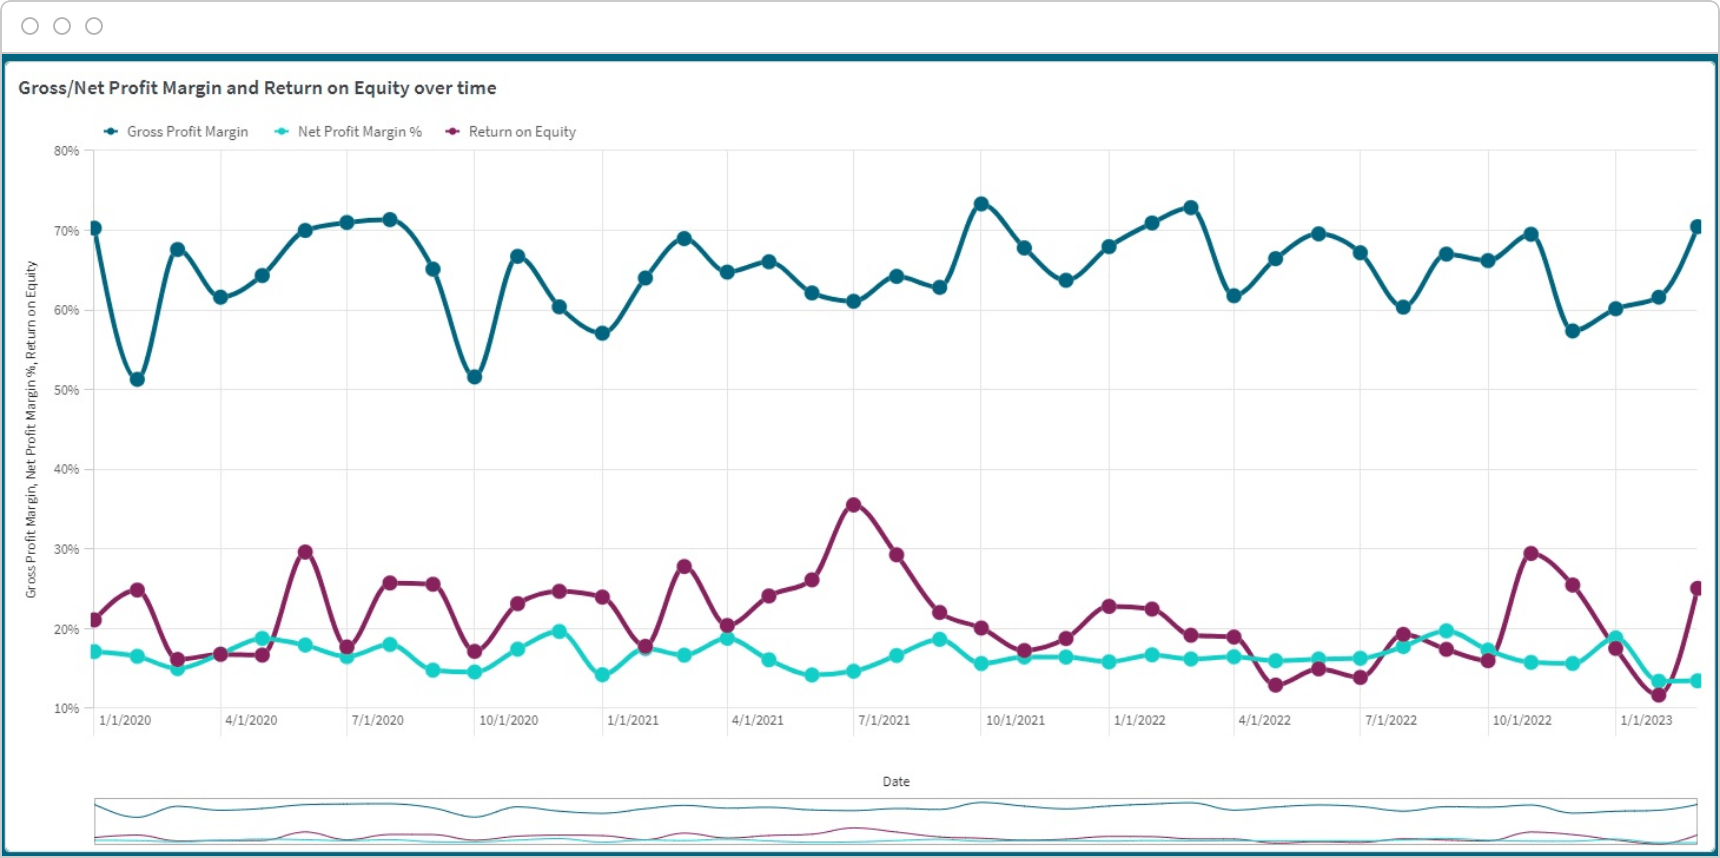
Profitability analysis involves measuring your company’s ability to generate profits from its operations. By calculating key profitability ratios such as gross profit margin, net profit margin, and return on equity, you can assess your company’s financial performance and compare it to industry benchmarks.
Leverage analysis, also known as financial risk analysis, involves measuring your company’s use of debt to finance its operations and assessing your ability to meet financial obligations, such as debt payments and other liabilities. By calculating key leverage ratios such as debt-to-equity (D/E) ratio and interest coverage ratio, you can understand your company's risk profile and ability to service its debt obligations. Your D/E is calculated by dividing your company’s total amount of debt by the total amount of shareholder's equity. Total debt is the sum of all your company’s short-term and long-term debts, including loans, bonds, and other liabilities. Total equity is the sum of all your company’s common stock, preferred stock, and retained earnings.
Growth analysis involves assessing your company’s growth potential and identifying opportunities for expansion. Analyzing key growth metrics such as revenue growth, market share, and customer acquisition rates, helps you determine whether your company is likely to grow or decline in the future.
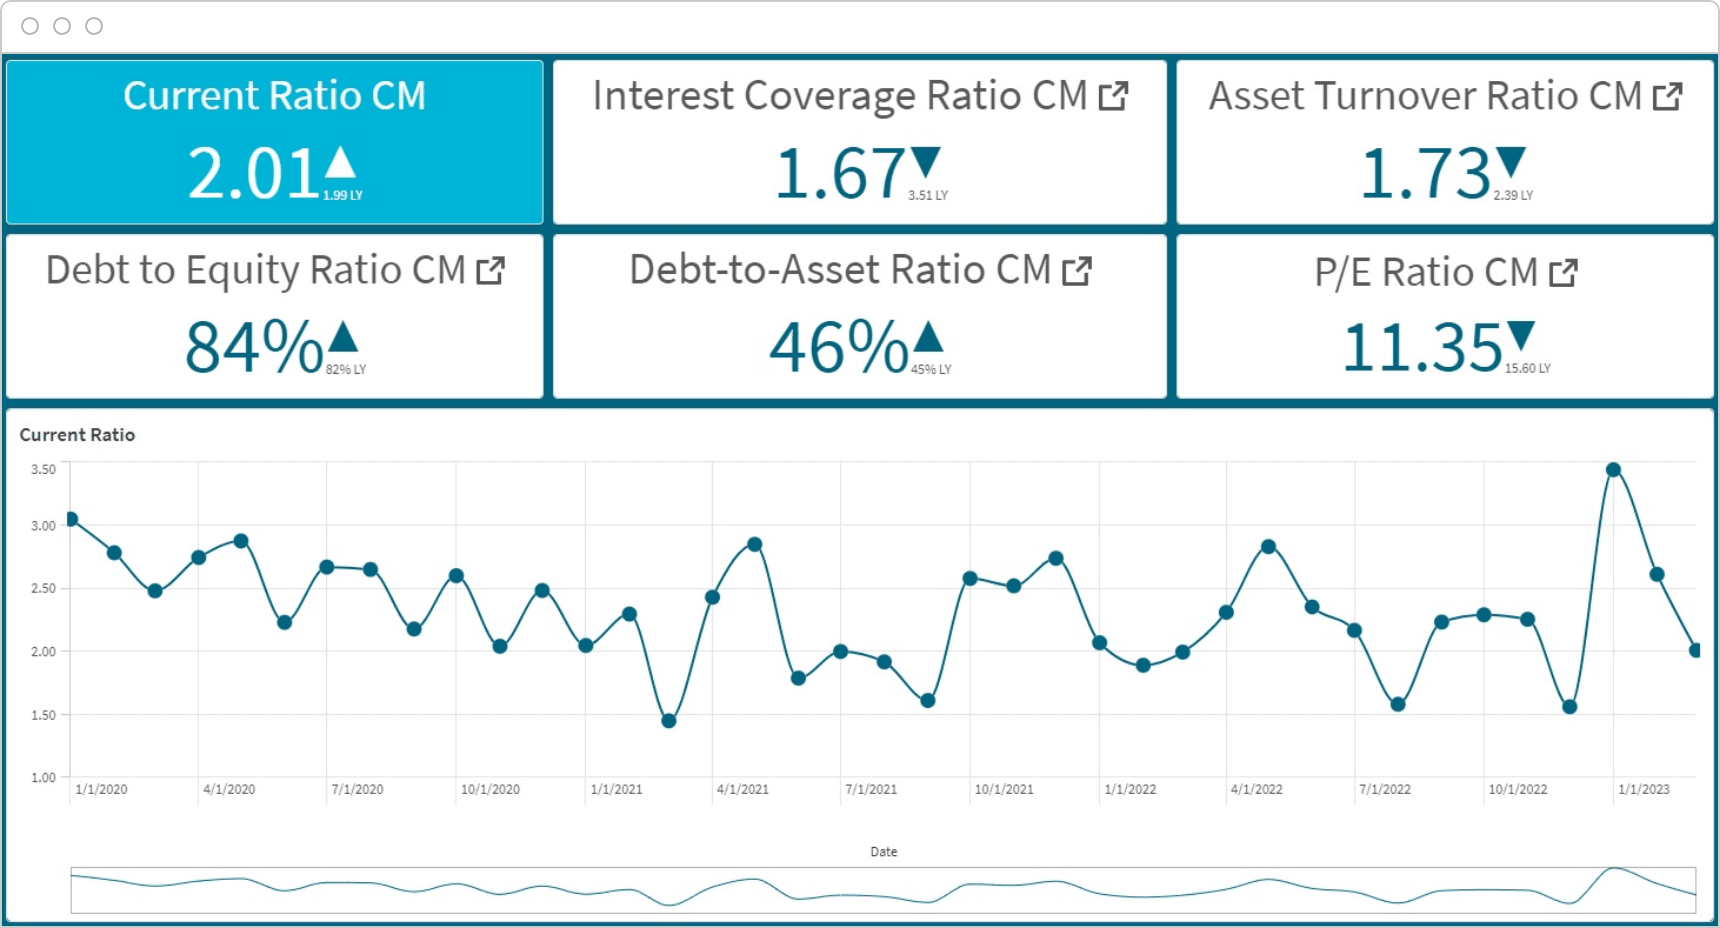
Liquidity analysis involves measuring your company’s ability to meet its short-term financial obligations. Analyzing liquidity and stability ratios such as current ratio and quick ratio, helps you assess your company’s ability to pay its bills and avoid financial distress. The current ratio is calculated by dividing your current assets by your current liabilities and a good current ratio is between 120% and 200%, which means that your business has 2 times more current assets than liabilities to cover debts.
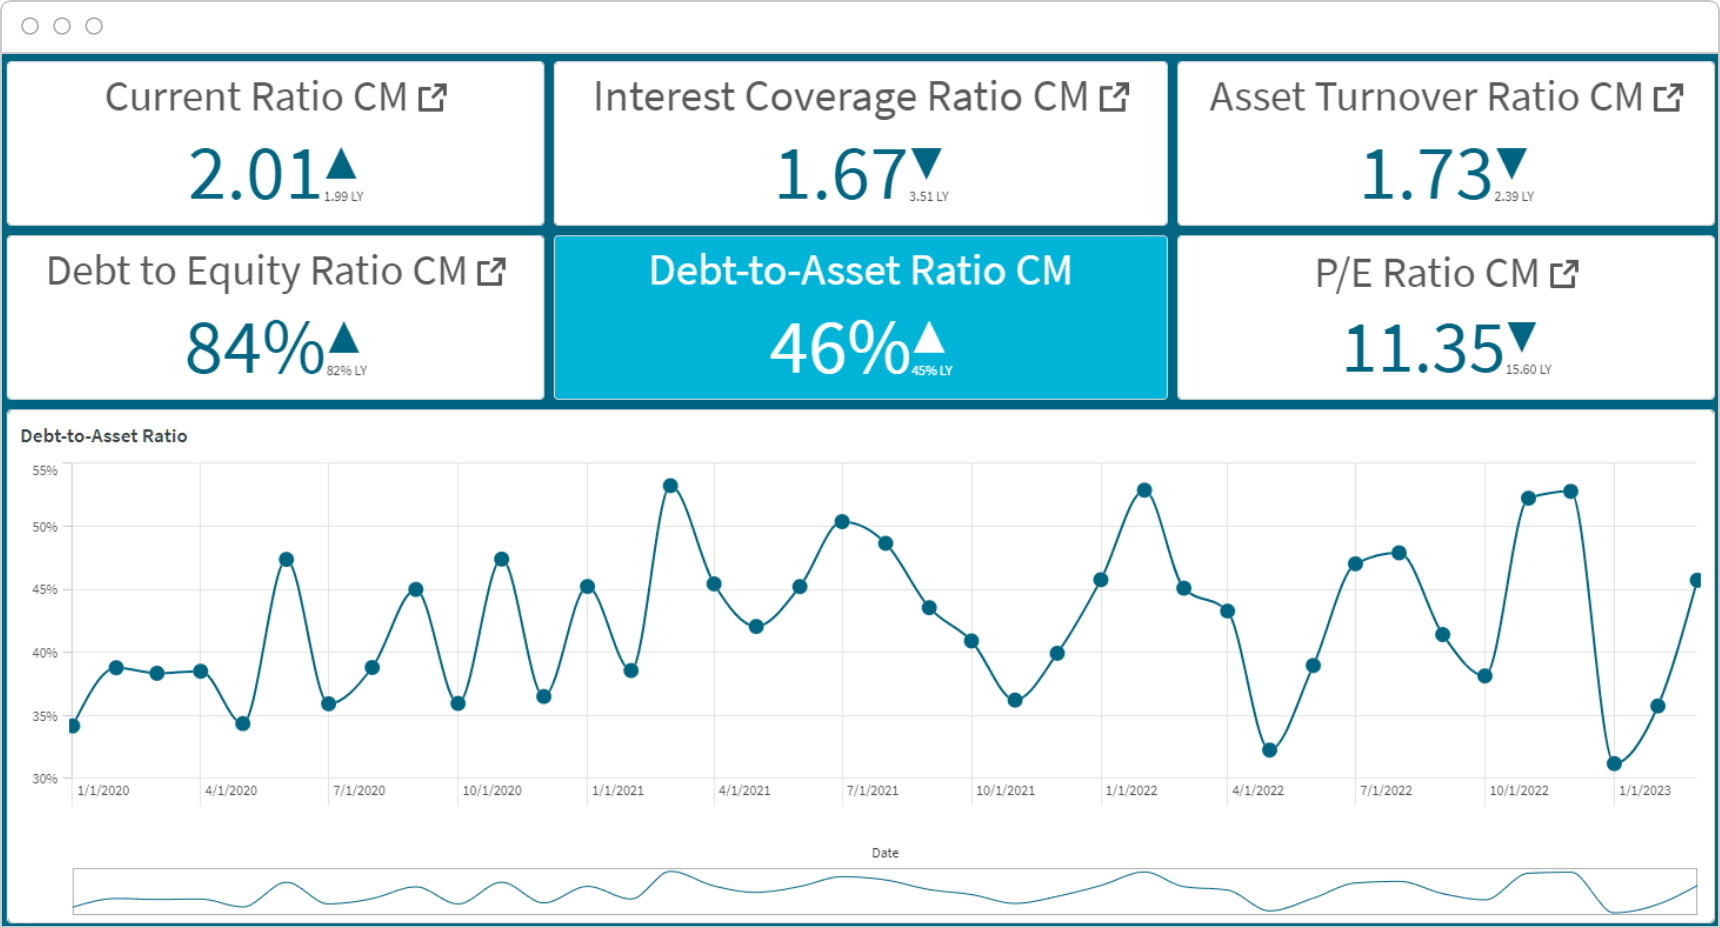
Solvency analysis, such as the debt-to-asset ratio, measures your company’s ability to meet its long-term obligations and ability to weather economic downturns or other challenges. Your debt-to-asset ratio is calculated by dividing your company’s total amount of debt, including loans, bonds, and other liabilities, by the total amount of assets, including cash, inventory, property, plant, and equipment.
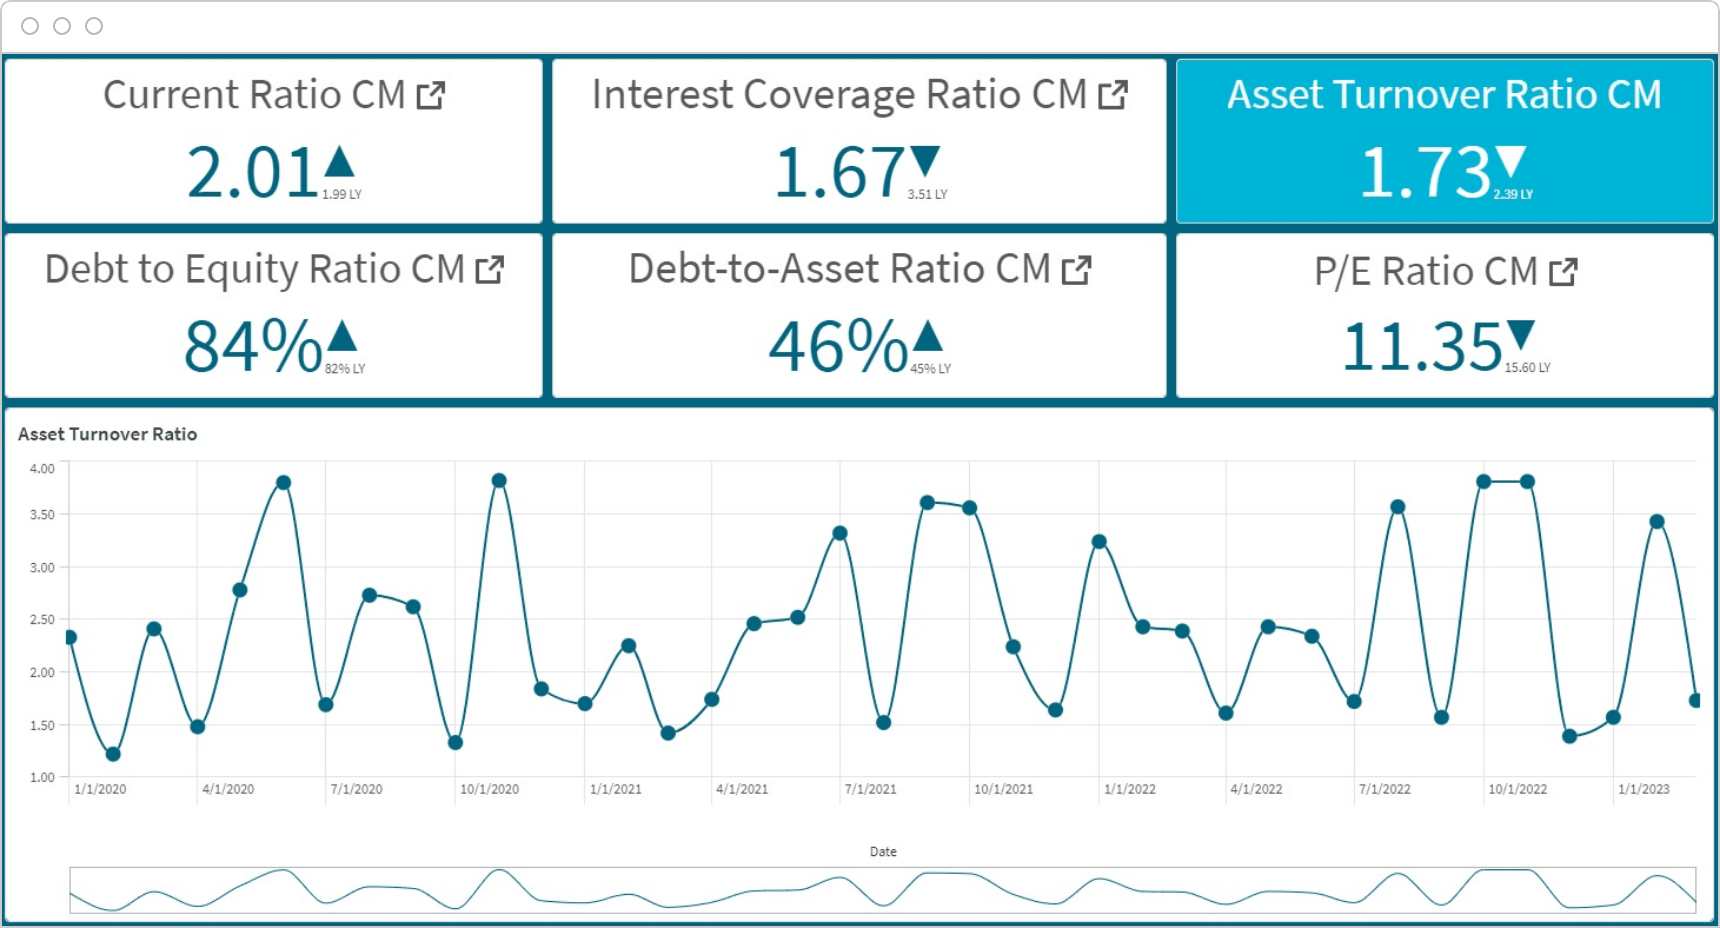
Efficiency analysis involves measuring a company's efficiency in using its resources to generate revenue. By analyzing key efficiency ratios such as asset turnover ratio and inventory turnover ratio, investors and analysts can assess the company's ability to optimize its operations and maximize profitability. Asset turnover ratio indicates how many dollars of revenue your company generates per dollar of assets. It’s calculated by dividing your company's revenue by its total assets. In general, asset turnover ratios in the range of 0.5 to 2.0 are considered typical for most industries.
Cash flow analysis involves examining your company's cash inflows and outflows to determine its ability to generate cash and manage its cash flow. It is important to note that your company’s profitability does not necessarily equate to a positive cash flow.
Rates of return analysis involves measuring your company’s rates of return on its investments. By analyzing key return metrics such as return on investment and return on assets, investors and analysts can assess your company’s ability to generate profits from its investments.
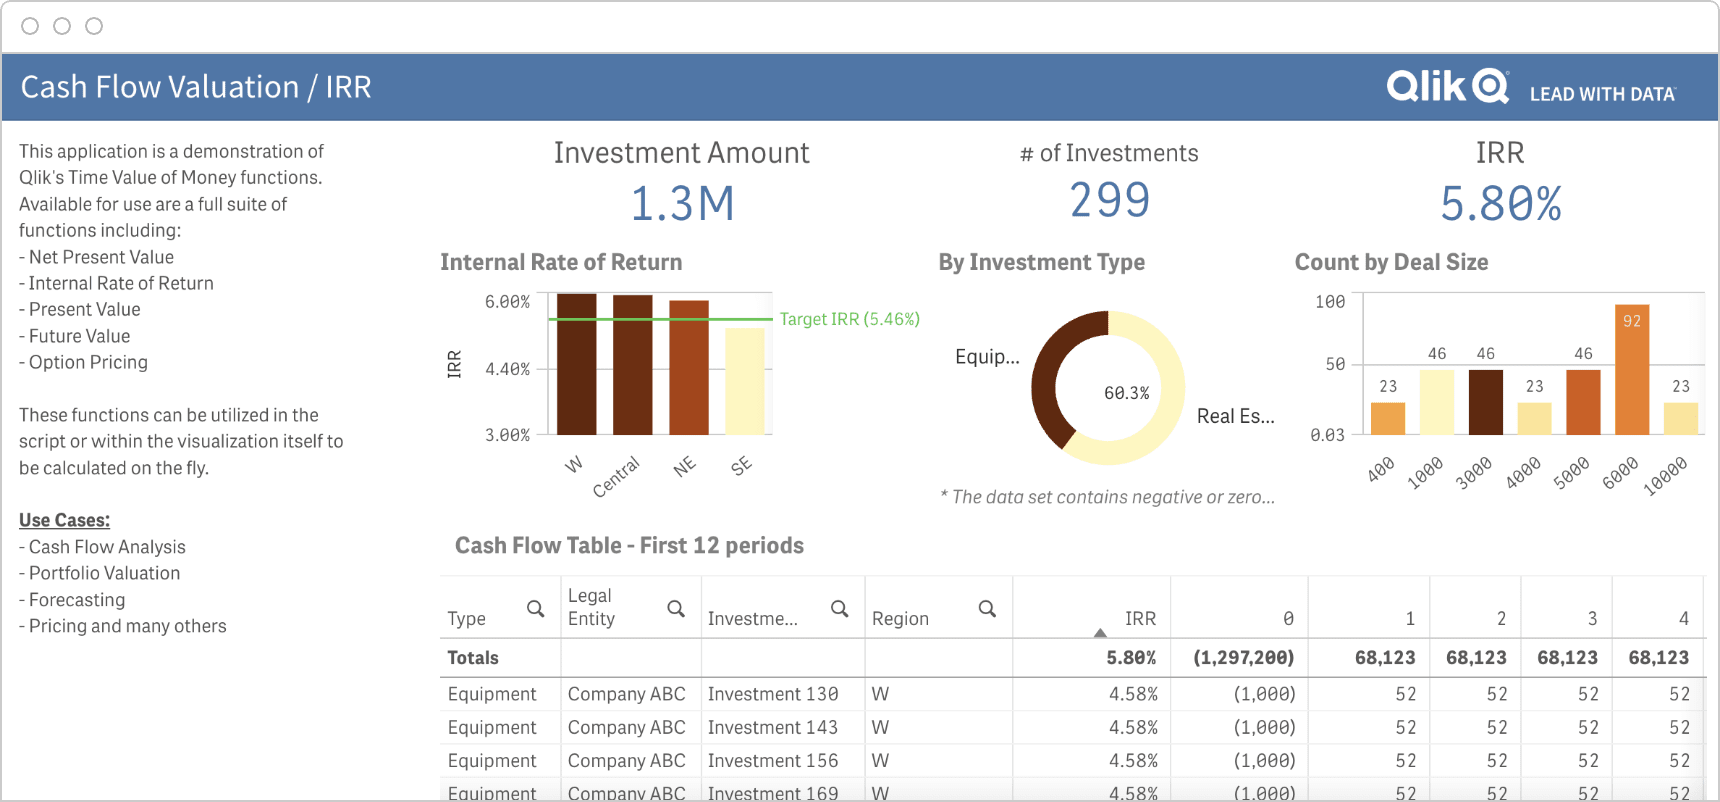
This Cash Flow Valuation Analysis example displays various cash flow-related key performance indicators (KPIs) including the internal rate of return (IRR) by region compared to a target IRR, investment count by type, and a detailed cash flow table. Additionally, real-time indicators like the cash conversion cycle and working capital ratio could be incorporated. To aid in cash flow management, regression analysis can be utilized to forecast cash flow.
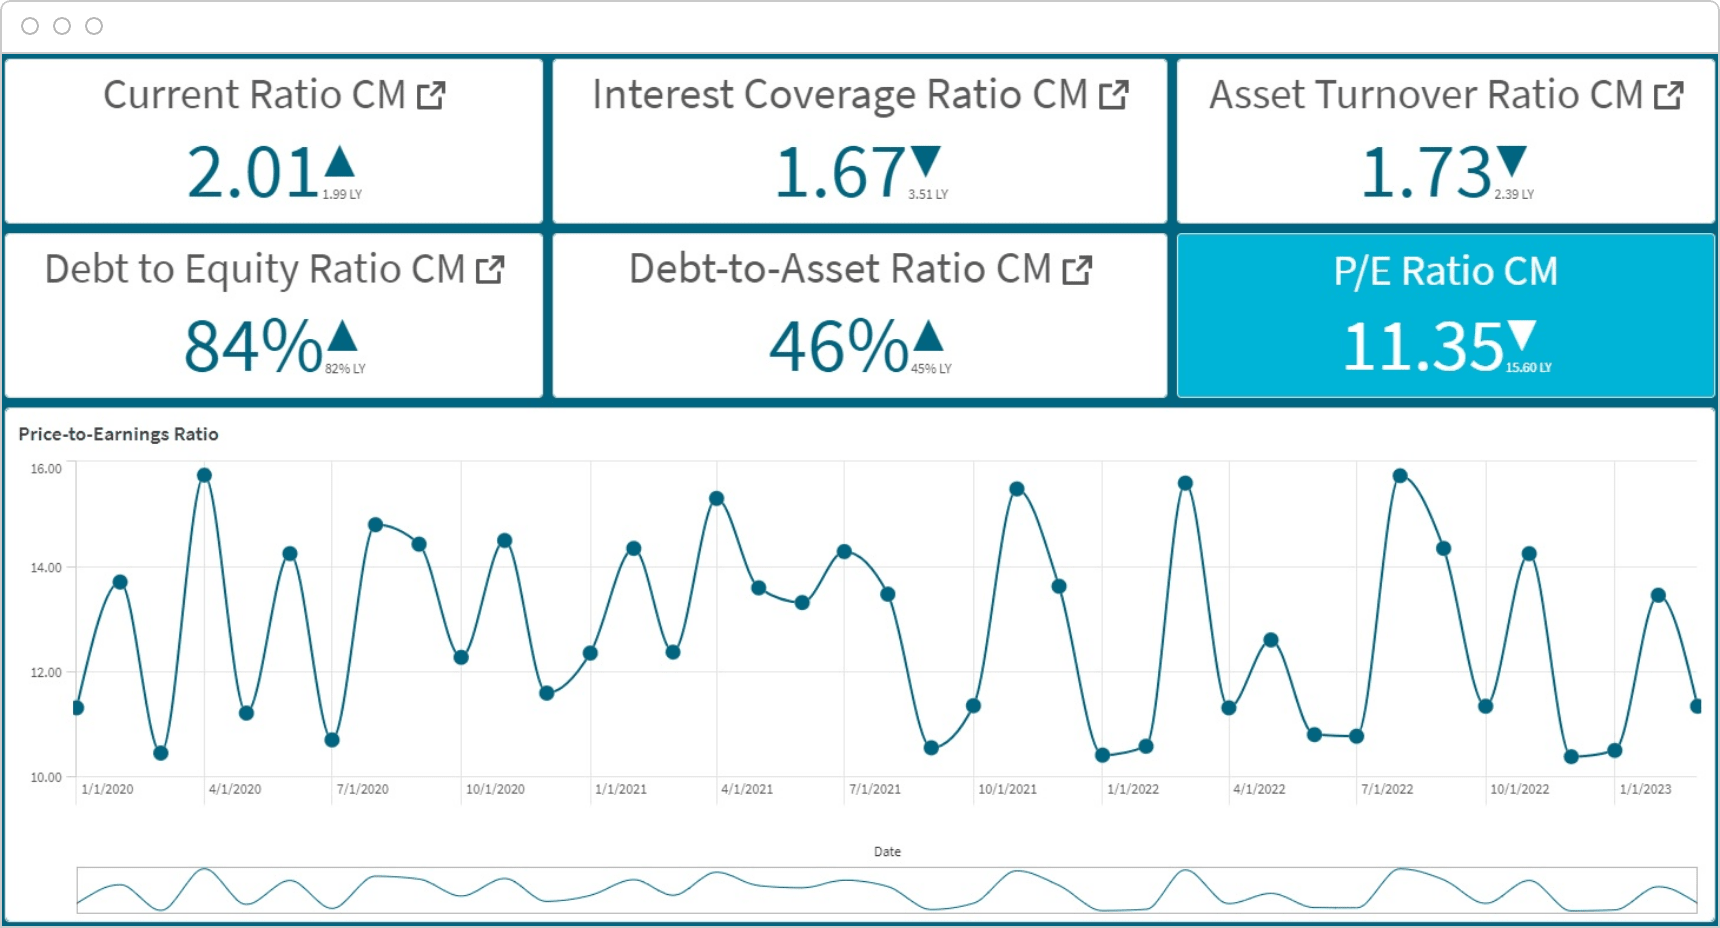
Valuation analysis involves determining your company’s intrinsic value based on its financial performance and other relevant factors. By using valuation models such as the price-to-earnings (P/E) ratio and discounted cash flow analysis, you can understand the price investors are willing to pay for your company's earnings per share (EPS) and assess if your company's stock is overvalued or undervalued. Your P/E is calculated by dividing your current market price per share by your company's EPS. A P/E ratio between 10 and 20 is considered to be a reasonable range for many companies.
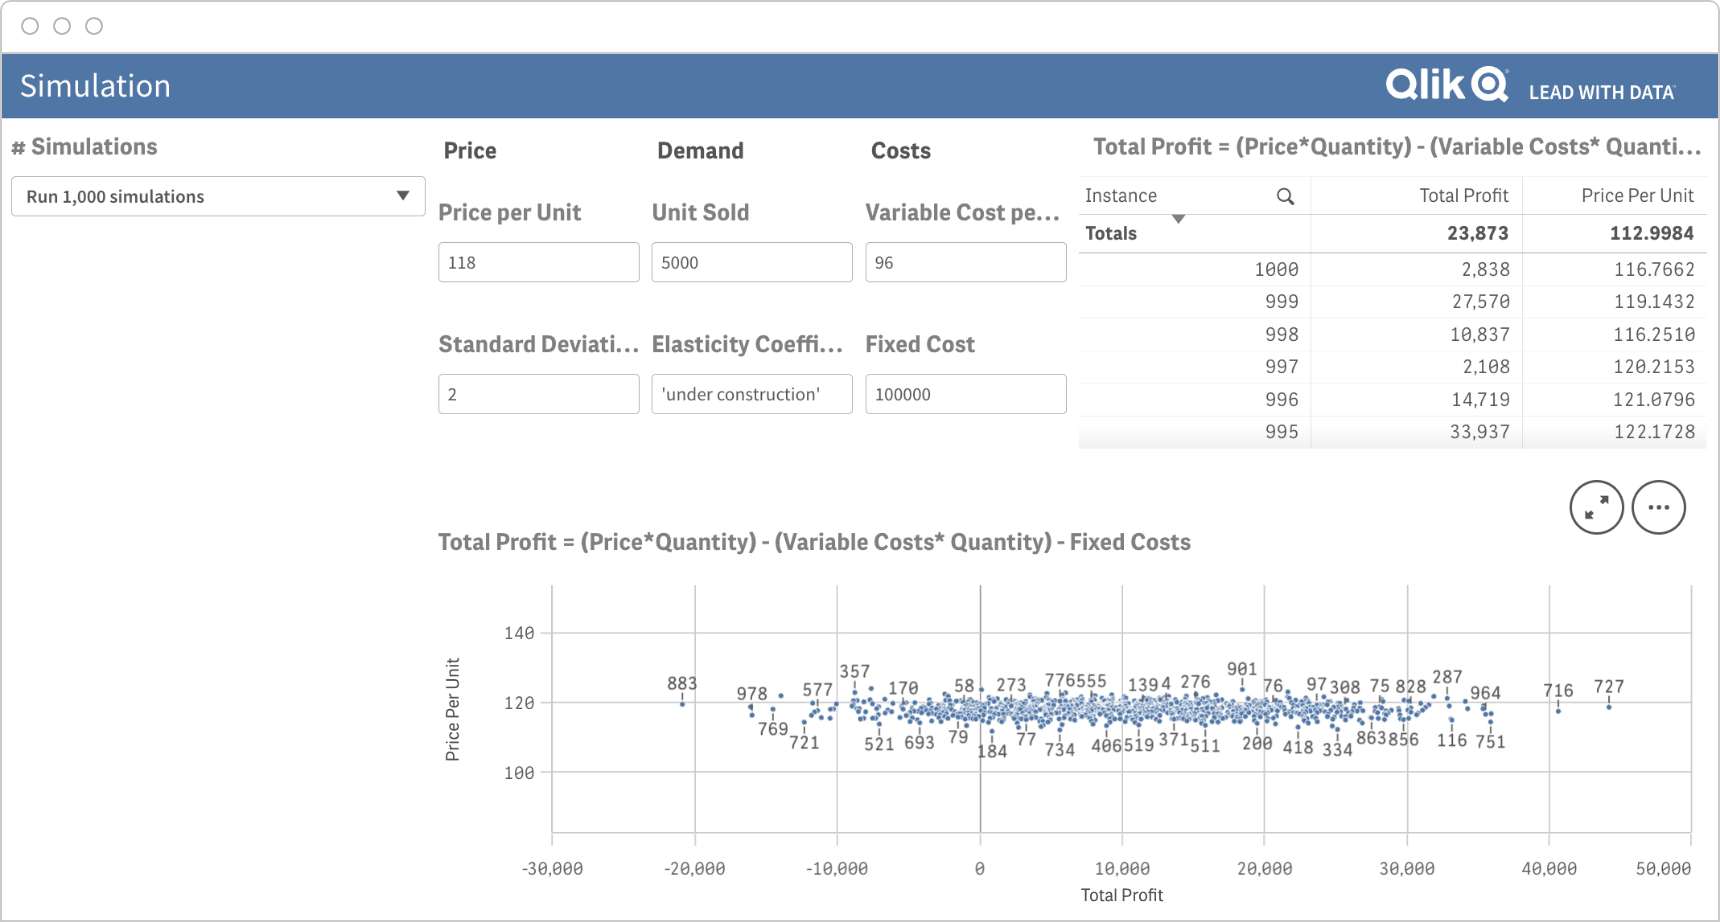
Scenario and sensitivity analysis involves modeling different scenarios and assessing the impact of changes in key variables on your company’s financial performance. This allows you to assess your company’s risk exposure and identify potential areas of concern.
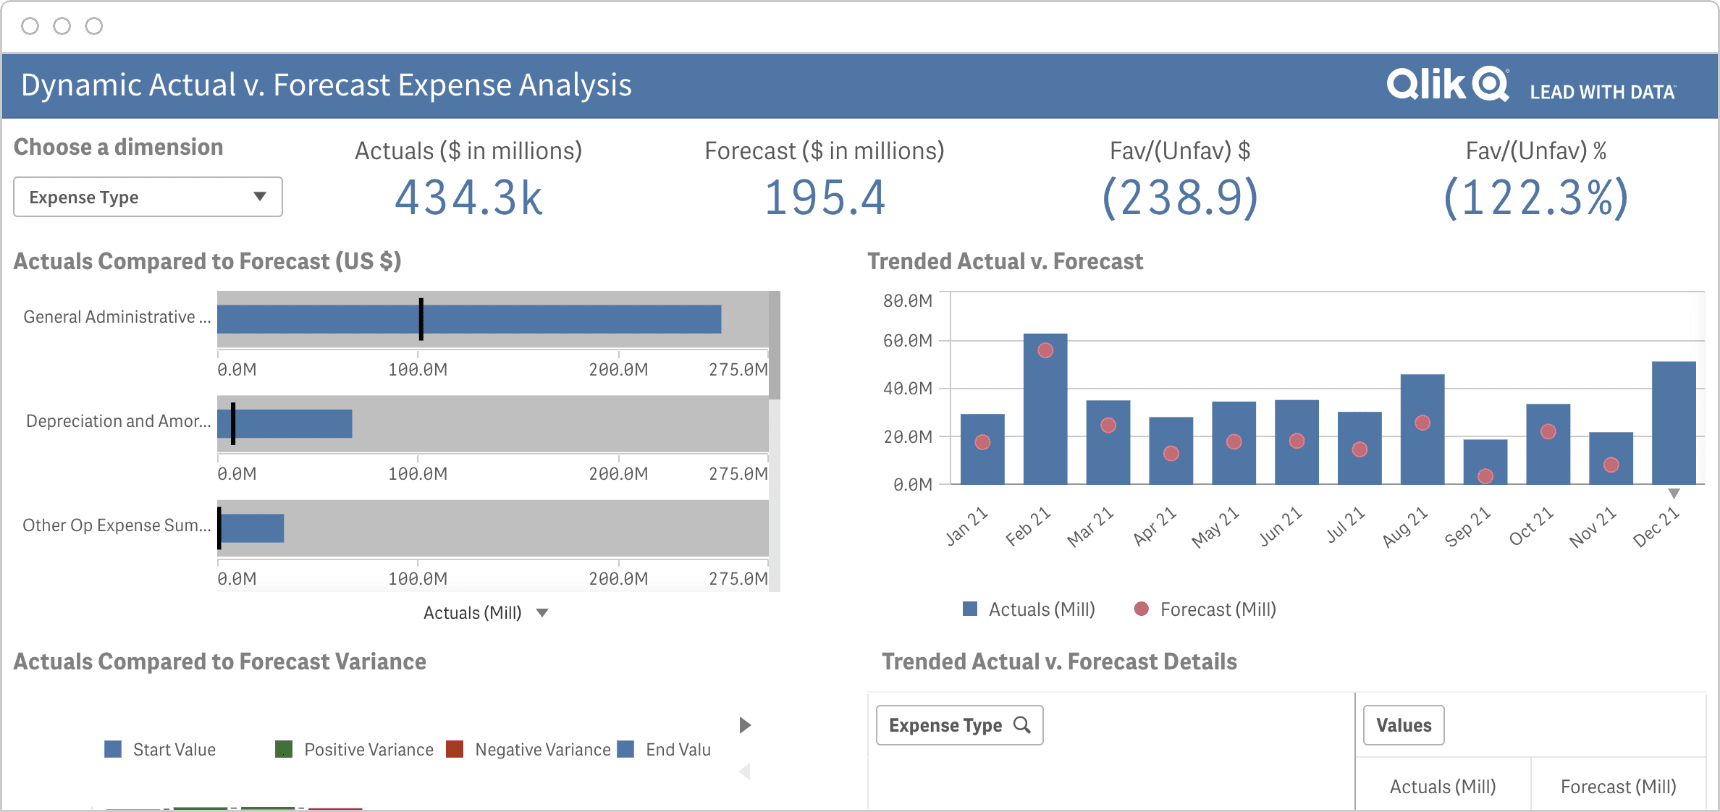
Variance analysis involves comparing actual financial results to budgeted or forecasted results to identify areas where the company may be falling short. By analyzing variances, you can help the company adjust its financial projections and identify potential areas of concern.
This Actual vs Forecast Analysis example compares between actual expenses and forecasts for a specific time frame, as well as the trend of expenses over time for each expense category. With a modern and integrated financial dashboard, you can easily explore this data in greater detail and extract actionable insights.
Trend analysis involves looking at your company’s financial statements over a period of time to identify patterns and trends in your company's financial performance. This can help you assess your company’s financial health and predict future performance.
Turnover ratio analysis looks at how effectively your company is using its assets to generate revenue. By analyzing turnover ratios such as accounts receivable turnover and inventory turnover you can assess how efficiently your company is managing its resources. Inventory turnover is calculated by dividing the cost of goods sold by your average inventory for the period. The ideal inventory turnover ratio varies across industries, but a ratio between 5 and 10 is often considered a good range.
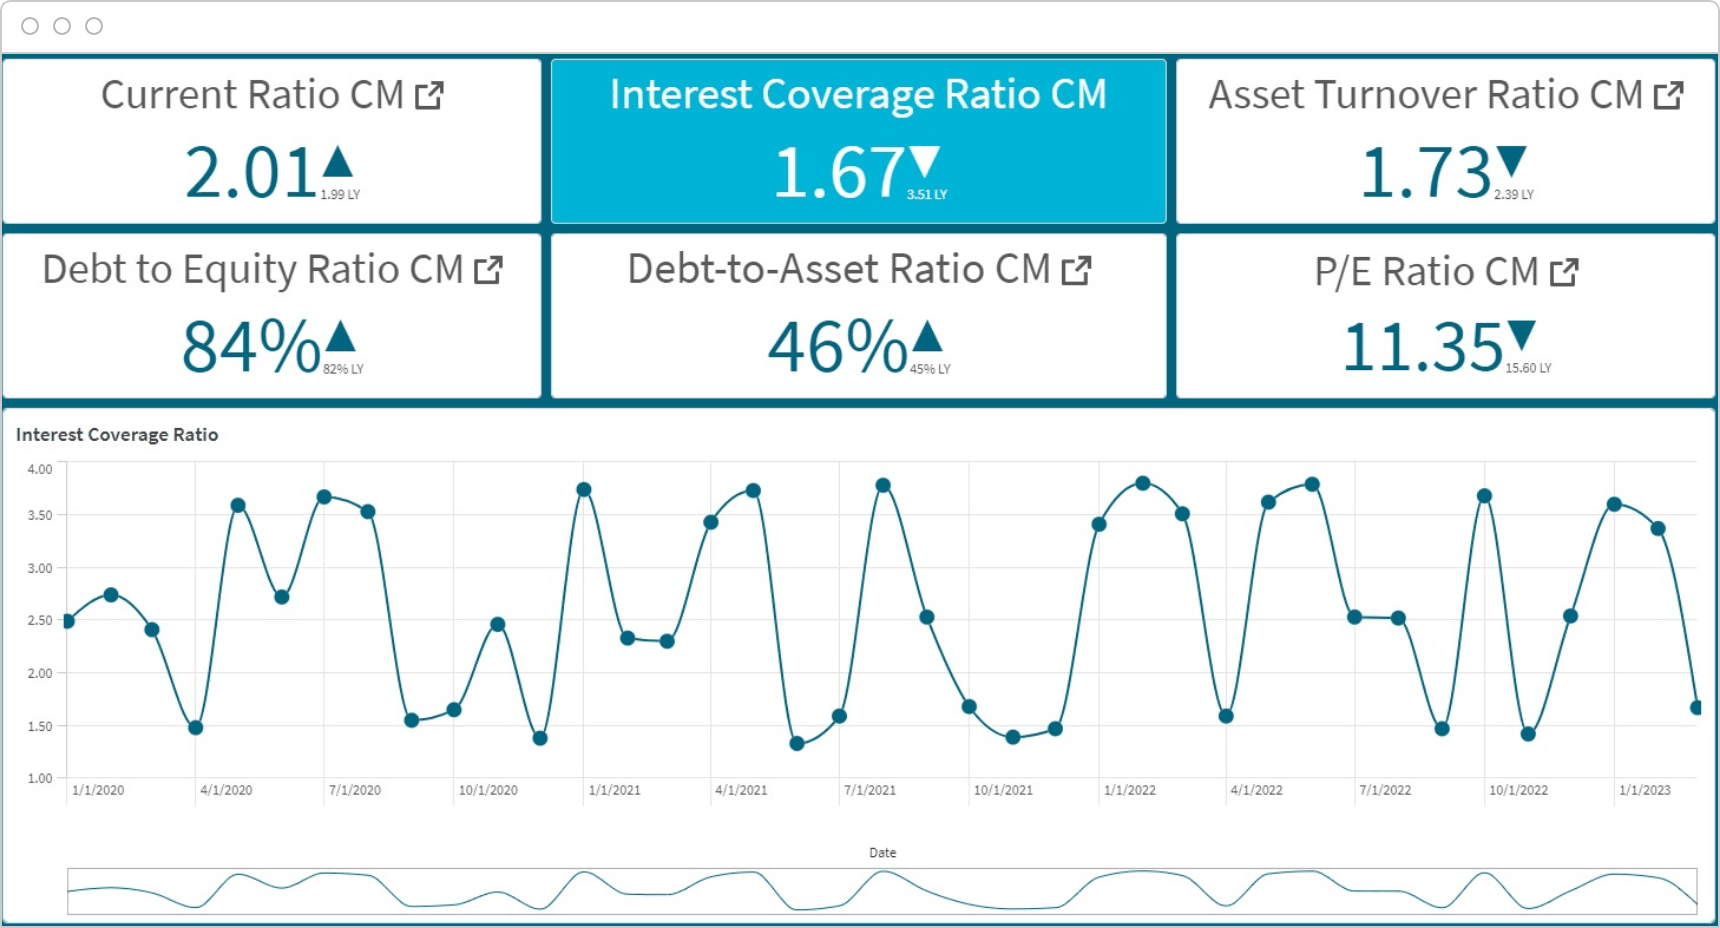
Coverage analysis involves assessing your company’s ability to meet its financial obligations, such as debt payments and interest expenses. By analyzing coverage ratios such as the interest coverage ratio (ICR) and the debt service coverage ratio, you can assess your company’s ability to pay its debts and avoid financial distress. ICR is calculated by dividing your company's earnings before interest and taxes (EBIT) by its interest expenses. Generally, a higher ICR indicates that a company is better able to meet its interest obligations and has a lower risk of defaulting on its debt. A company with an ICR below 1 may struggle to meet its interest payments and may be considered to have a higher risk of default.
Financial analysis allows you to identify the financial strengths and weaknesses of the organization and to make informed decisions about its future strategies. It is essential for investors, lenders, and creditors to assess the company's ability to pay back loans or to invest in the company.
Financial analytics tools can bring together data from all your systems to give you a holistic view of your business. This not only saves time, it helps you gain broader insights to predict and improve performance.
Financial statement analysis is critical for your organization because it:
Helps you make informed decisions by providing critical information about your company's financial health. A financial analysis report can help you make better decisions about investing, lending, or extending credit.
Provides insight into your financial performance, which can be used to identify the areas where your company is performing well or where it needs improvement.
Helps you identify the financial strengths and weaknesses of your company, which can help in developing strategies to leverage strengths and address the weaknesses.
Enables financial forecasting by providing the necessary information for forecasting future performance, which is essential for budgeting and planning.
Financial analysis also helps investors decide whether to invest in a particular company or fund. Investors can more easily compare different companies and predict future performance.
Financial Analysis Software
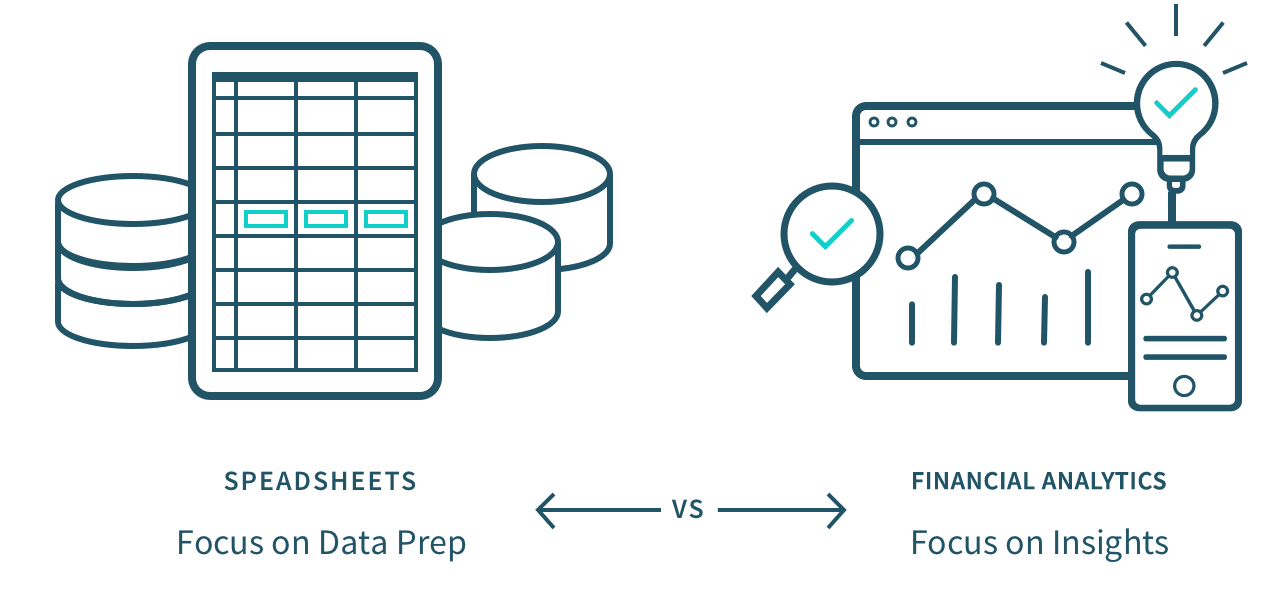
Many financial analysts use spreadsheets like Excel to analyze data. While this may seem convenient, spreadsheets introduce many challenges. Modern financial analysis software overcomes these issues.
Spreadsheet limitations:
You usually spend far more time manually extracting and prepping data than you do analyzing it.
You can't dig into the spreadsheet visualizations and explore your data because spreadsheet dashboards are not interactive. And using additional visualization tools adds another step to your process.
You have lower confidence in your analysis because the ungoverned process can introduce inaccurate data.
Financial analysis software capabilities:
You can focus your time exploring and analyzing data because data prep and integration is automated and accelerated.
You can uncover hidden insights and relationships by exploring interactive visualizations, leveraging AI recommendations, and even building machine learning models using automated machine learning (AutoML).
You can trust your data because it is governed and you can track data integrity.
You can analyze real-time data to take immediate action, including triggering events in other applications.
Modern Analytics Demo Videos
See how to explore information and quickly gain insights.
In addition to the limitations of spreadsheets listed above, here are key challenges to be aware of as you perform financial planning and analysis in your organization.
Reliance on Historical Data. Financial statement analysis often relies on historical data, which may not be an accurate predictor of future performance. And, given the pace of business today, you may need real-time data about your market, customers, and operations to respond quickly.
Complex Models & Big Investment. Historically, if you wanted to conduct predictive or prescriptive analytics, you had to find and hire data scientists to develop custom machine learning models and make big investments in hardware and data engineers to integrate, store and manage your data. Automated machine learning (AutoML) now makes it easier for you to build, train, and deploy custom ML models yourself.
Limited View. Financial analysis typically only involves financial statements and doesn’t include other key factors such as industry trends, regulatory issues, and management capabilities.
Inaccurate Data. Many companies do not have adequate data governance policies in place and/or analysts manually gather and prepare the data themselves. This can result in intentional or accidental errors in the financial data.