The Masters Golf Championship is an event steeped in history and tradition, capturing the hearts of golf enthusiasts worldwide.
As we gear up for this year's tournament, let's take a journey through the annals of golfing excellence, while also introducing an innovative demo by Qlik that provides key analysis and insights. The demo uses Qlik Sense and our APIs to build the webapp.
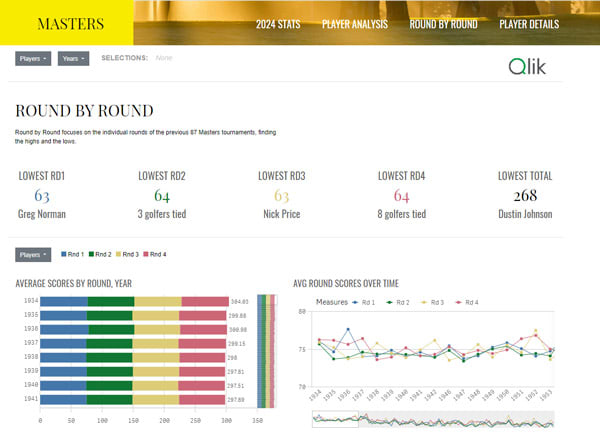
Did you know that Dustin Johnson holds the record for the lowest total score in Masters history? Or that Jack Nicklaus holds the title for the most cuts made, a testament to his enduring skill and consistency on the Augusta National course?
A tradition unlike any other: The Masters Golf Championship
Since its inception in 1934, The Masters has been a pinnacle of achievement in the world of golf. Hosted annually at the Augusta National Golf Club in Georgia, USA, this prestigious tournament has seen legendary performances, dramatic victories, and unforgettable moments etched into the fabric of golfing history.
This year, as we celebrate the legacy of The Masters, we are thrilled to introduce Qlik's groundbreaking demo. With this innovative tool, we delve deeper into the tournament's dynamics, providing insights that transcend traditional analysis.

Unveiling insights: The masters through data
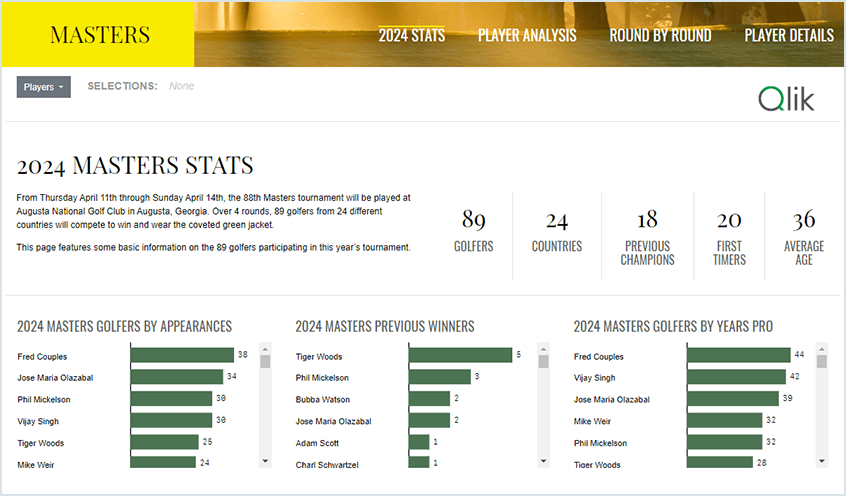
Qlik's demo offers a comprehensive view of the 89 golfers participating in this year's championship. Among them are 18 previous champions, returning to Augusta National with the hopes of adding another Green Jacket to their collection, alongside 20 first-time competitors, eager to make their mark on the grand stage.
Unlocking historical data: Key insights
Most Cuts Made: Delve into historical data to discover which golfers have consistently performed under pressure, making the most cuts in Masters history.
Prize Money Earners: Gain insights into the financial aspect of the tournament, uncovering which players have amassed the highest prize money earnings over the years.
Lowest Scores in Each Round: Explore the data to identify the players who have delivered remarkable performances, achieving the lowest scores in each round of the tournament's history.
Empowering decision-making with data
With Qlik's demo, golf enthusiasts, analysts, and professionals alike can leverage insights to inform, predict and gain a deeper understanding of the game. By harnessing the power of data, we unlock a new dimension of appreciation for The Masters Golf Championship and its storied legacy.
As we eagerly anticipate the unfolding drama and excitement of this year's tournament, let us embrace the transformative potential of data virtualization, reshaping how we perceive and engage with the sport we love.
Join us on this journey as we unveil insights and celebrate the timeless tradition of The Masters Golf Championship by checking out the demo here.


