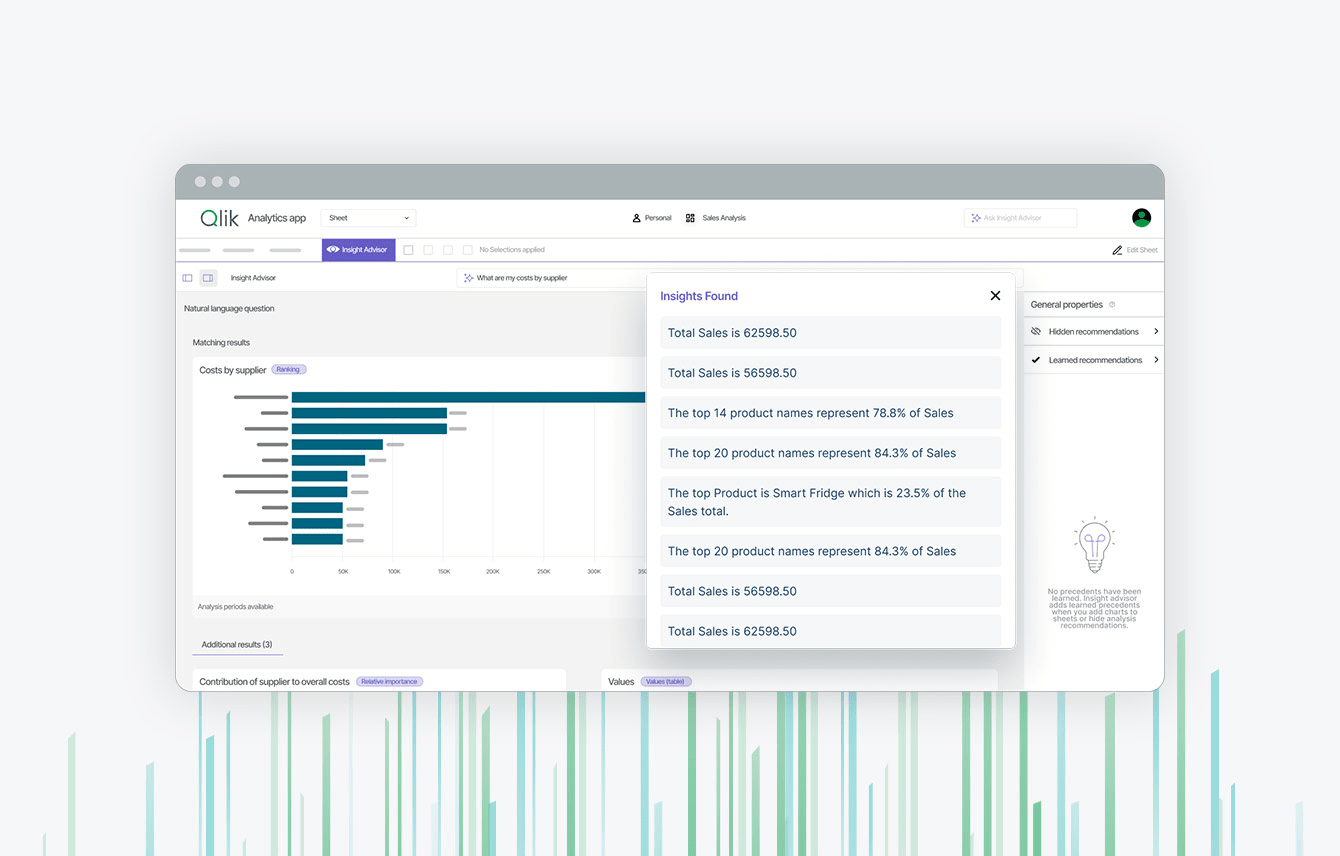
Screenshot of the Qlik Analytics app, showing an Insight Advisor interface with a bar chart visualizing costs by supplier and a white card displaying several "Insights Found" sales metrics.

Introducing Qlik Cloud Analytics

Make sharper moves with Qlik Cloud Analytics®. It’s everything you love in Qlik Sense®, but turbocharged with AI that turns insights into action. Stop just watching data — work together, spot what matters, and act on it right away.

QLIK SENSE® | MODERN ANALYTICS

Next-Level On-Premises Insight and Analytics From Your Data

Empower people at all skill levels with AI-powered insights and predictions that inform intelligent action when it matters most.

Click to play "Qlik Sense Tour" video via Vidyard.

Key Features of the On Premise Analytics Platform

Highly interactive. Always in context. Lightning fast. No one else compares.

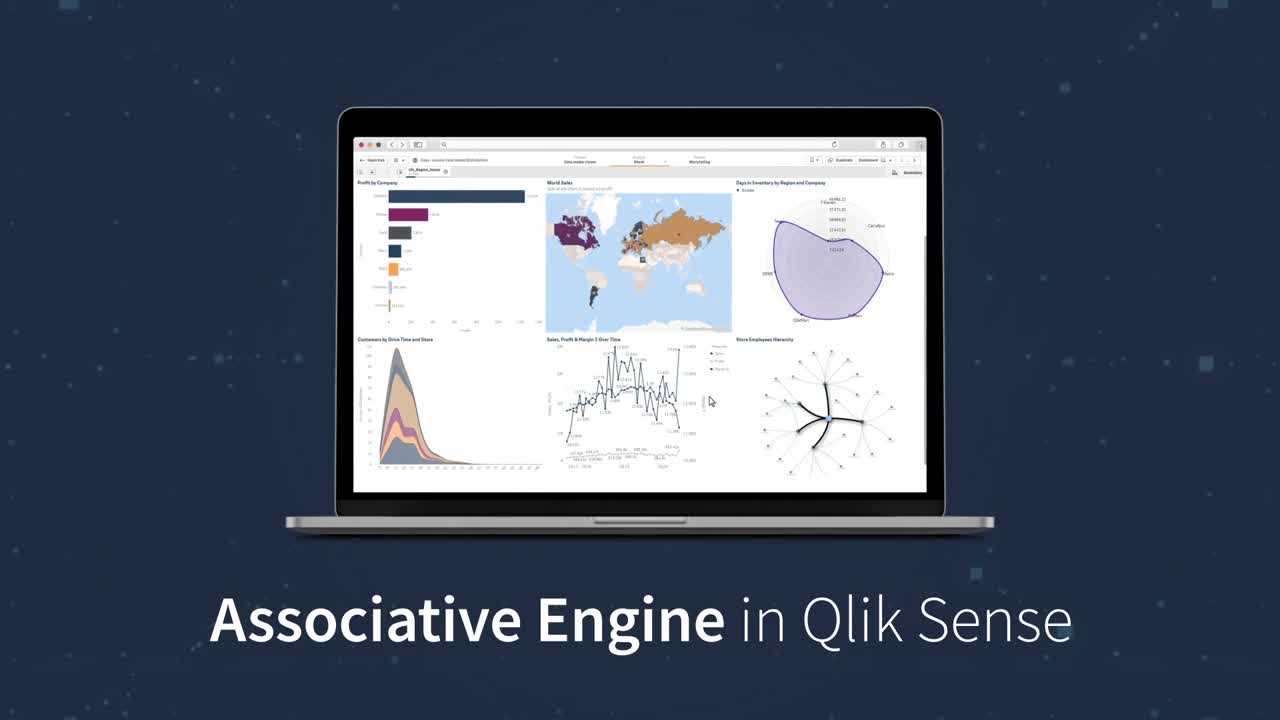
Qlik’s one-of-a-kind associative analytics engine brings unmatched power to explore your data and uncover insights.

Make selections freely in all objects, in any direction, to refine context and make discoveries. Get instant calculations at the speed of thought, at scale. Yeah, it’s a big deal. And it’s why Qlik Sense takes you way beyond the limits of query-based analytics and dashboards our competitors offer.

Click to play "Qlik Analytics Engine" video via Vidyard.

Drive deeper insight with augmented analytics

With AI and ML built into our foundation, we deliver a full range of uniquely integrated augmented analytics capabilities that allow more people, regardless of skill level, to reach their full potential with data. Take advantage of:

  • Automated insight generation

  • Search and natural language interaction

  • AI-assisted creation and data prep

  • AutoML & predictive analytics

A screenshot of a Qlik Sense dashboard displaying bar charts, a pie chart, and a map. The main chart shows sales by product name, with additional insights on sales distribution and trends.

Take intelligent action in the moment

Organizations need a dynamic relationship with information that reflects the current moment. We combine a real-time data pipeline with action-oriented capabilities that provide in-the-moment insights and drive immediate action.

Seize every business moment with intelligent alerting, powerful collaboration, mobile and embedded analytics, and automated triggering of immediate actions.

Qlik interface showing a workflow with various Qlik apps and services on the left, and a "Send Message" configuration panel on the right.
Desktop and mobile phone showing Qlik Sense dashboards

Get Started
with Qlik Sense


See why more than 30,000 customers trust Qlik. Easily explore information and quickly gain insights.

  • Connect and combine data from hundreds of data sources

  • Best-in-class visualization and discovery at your fingertips

  • Get AI-generated insight suggestions, automatically

Qlik Sense capabilities

Click to play "Qlik Sense® Visualizations" video via Vidyard.

Self-service visualization

Easily combine, load, visualize, and explore your data, no matter how large (or small). Search, select, drill down, or zoom out to find your answer or instantly shift focus if something sparks your interest. Every chart, table, and object is interactive and instantly updates to the current context with each action.

A dashboard showing store performance metrics, including the number of stores (183), sales comparison to last year (34%), sales by store chain, cost of goods sold, geographic sales distribution, and growth profit.

Interactive dashboards

With Qlik Sense, dashboards become a powerful jumping-off point to make better, data-driven decisions. Create, share and distribute powerful dashboards to support executives, business leaders, and anyone else that needs to stay on the pulse of the business. Every element is interactive, so when something stands out, it's easy to dive in and explore what’s happening.

Click to play "Qlik Sense® Search-based Analysis" video via Vidyard.

Search and conversational

Make interacting with data simple and generate powerful insights using natural language. With search-based visual discovery, Insight Advisor auto-generates the most relevant and impactful analyses and insights for the user, based on natural language processing (NLP). And with conversational analytics, you get a fully interactive natural language experience in Qlik Sense.

Two graphs: left graph shows a fluctuating line chart with a trend line, right graph shows a scatter plot with different colored clusters indicating "Sales" vs "Average Cost of Sales.

Advanced and predictive analytics

Click to play "Qlik Sense® Intelligent Alerts" video via Vidyard.

Alerting and action

Immediately react to changes in your data with alerting and automation. Unlike other products, our alerting technology is fully data-driven, not based on individual visualizations, so you can monitor all your data without limitations. And you can go beyond alerting with event-driven actions which automate routine tasks and enable your key tools to work with your analytics.

A person wearing a hat leans out of a car window. Overlayed is a report titled "ACME Bonds, FY" with investment data, risk scale, net asset value, portfolio composition, and fund evolution charts.

Reporting

Build, publish and share great looking reports in popular formats like Microsoft® Office and PDFs. Qlik Sense analytics offers highly flexible design and formatting control. Easily schedule reports for distribution, customized for recipients, with delivery via email, shared folders, or a centralized hub.

Three smartphone screens display a data visualization app featuring various charts and graphs, including bar charts, line charts, and maps, showing sales data by quarter, region, and lead status.

Mobility

Qlik Sense is built for mobile, with responsive design and touch interaction native to the platform — so you can easily create and explore analytics on any device. Build analytics apps once and they work everywhere. And get fully interactive offline analysis and integrated alerting with push notifications for insight and action at the point of decision.

Click to play "Qlik Sense® Embedded Analytics" video via Vidyard.

Custom and embedded

Qlik Sense is a complete data analytics solution that helps you tackle even the most complex analytics challenges. The complete set of open APIs enables you to fully customize analytics solutions. Rapidly develop custom apps, new visualizations, and extensions, or embed fully interactive analytics within the applications and processes people focus on every day.

More capabilities

Icon of a clipboard

Data prep and connectivity

Qlik Sense provides a complete set of data preparation and integration capabilities, allowing users to work with nearly limitless combinations of data, both big and small.

Icon of cataloging

Data catalog

A well-governed, self-service catalog of all analytics-ready data makes it easy to find the right data and know its origin and journey. Use all your data with confidence because you can easily find it and trust it.

Icon of automation

Application automation

Build automation workflows and trigger event-driven actions in Qlik Sense and other cloud applications through a visual, low-code environment. A broad library of connectors are available to cloud applications.

Icon of conversation and notes

Collaboration and notes

Add narrative and context to analytics, and create discussion threads to interact with others actively around data. Support team decisioning with the critical business context needed for the best outcomes.

Frequently Asked Questions (FAQs)

What is the difference between Qlik Cloud Analytics and Qlik Sense?

Qlik Cloud Analytics brings all the power of Qlik analytics solutions in a cloud-based SaaS deployment. Qlik Sense is our on-premises solution for highly regulated industries and customers that prefer a client-managed offering.

What data sources does Qlik Sense integrate with?

Qlik makes it easy to connect and combine data from hundreds of data sources – from apps and databases to cloud services, files and more. Explore common data sources and connection options for Qlik Sense.

Does Qlik Sense have Artificial Intelligence (AI) capabilities?

Yes, Qlik Sense has AI technology built in at a foundational level, combined with our unique associative engine. Insight Advisor suggests analyses and insights, automates analytics creation and data preparation processes, and supports natural language interaction for search-based and conversational analytics. Qlik AutoML provides powerful key-driver analysis, predictive analytics, and what-if scenarios directly for analytics users and teams. And with advanced analytics integration, you can easily include predictive calculations from data science platforms and AutoML directly in Qlik Sense dashboards, supporting real-time business-user exploration.

How much does Qlik Sense cost?

For Qlik Sense client-managed pricing, please contact us. Qlik Cloud Analytics pricing can be found on the pricing page.

What makes Qlik Sense more than just another visual analytics tool?
What is on-premises analytics?

On-premises analytics is analytics software deployed and run on an organization's own servers and infrastructure, inside its own data centers, rather than hosted by a vendor in the cloud. The organization manages the hardware, security, and maintenance itself, which gives it full control over its data and environment. It's often chosen by highly regulated industries or organizations with strict data-residency, security, or compliance requirements. 

What is the difference between on-premises and cloud analytics?

On-premises analytics runs on infrastructure the organization owns and manages, offering maximum control over data and security but requiring in-house maintenance and upfront investment. Cloud analytics is hosted and managed by a vendor and accessed over the internet, providing faster setup, elastic scaling, and lower maintenance, usually on a subscription. Many organizations adopt a hybrid mix, and the choice generally comes down to control, compliance, cost model, and scalability needs. 

What is an analytics platform?

An analytics platform is an integrated software environment that provides the tools to connect to data, prepare and model it, analyze it, and present insights through visualizations, dashboards, and reports. Unlike a single-purpose tool, a platform supports the full analytics workflow and often adds capabilities like self-service exploration, augmented analytics, governance, and embedding. It gives an organization a unified foundation for turning data into decisions across many users and use cases. 

What is the difference between associative and query-based analytics?
What is guided analytics?

Guided analytics is an approach in which analytics applications are designed to lead users along a curated path — with predefined dashboards, workflows, and interactions — toward relevant insights. It sits between fixed static reports and fully open self-service, giving users freedom to explore within guardrails set by analytics designers. This helps less technical users reach reliable answers without getting lost, while keeping analysis aligned to business context. 

What is mobile analytics?

Mobile analytics is the delivery of analytics — dashboards, reports, and data exploration — on mobile devices like phones and tablets, so people can access insights anywhere. Well-designed mobile analytics uses responsive layouts and touch interaction, and often supports offline access and push notifications for alerts. It extends data-driven decision-making beyond the desk to the point where work and decisions actually happen. 

What is collaborative analytics?

Collaborative analytics is an approach that lets people work together on data analysis — sharing dashboards, adding notes and narrative, and discussing findings directly within the analytics environment. By capturing context and conversation alongside the data, it helps teams align on what the numbers mean and decide together. This turns analytics from a solo activity into a shared process that strengthens collective decision-making. 

What is data-driven decision-making?

Data-driven decision-making is the practice of basing decisions on data and analysis rather than intuition or guesswork alone. It involves gathering relevant data, analyzing it for insight, using those findings to guide choices, and then measuring the results. Organizations that build this into their culture — supported by accessible data and analytics tools — tend to make more consistent, defensible, and effective decisions. 

What is the difference between traditional and modern business intelligence?

Traditional business intelligence is typically IT-led and centered on static, predefined reports that business users request and wait for, which can be slow and inflexible. Modern BI emphasizes self-service, interactive visualization, and faster, more agile analysis, letting business users explore data and answer their own questions with less reliance on IT. The shift reflects a move from centralized reporting toward broad, governed access to data across the organization.

What is enterprise analytics?

Enterprise analytics is the practice of deploying analytics at organization-wide scale, so many users across departments can access consistent, governed data and insights. It goes beyond isolated tools or team-level dashboards to provide shared standards, security, and a common data foundation for the whole enterprise. The goal is to make trustworthy, well-managed analytics broadly available while maintaining governance, performance, and scalability. 

Customers making data work for AI

Introducing Qlik Cloud Analytics®