
Accelerate and simplify data warehouse design, development, testing, deployment, and updates.
KEY RESOURCE
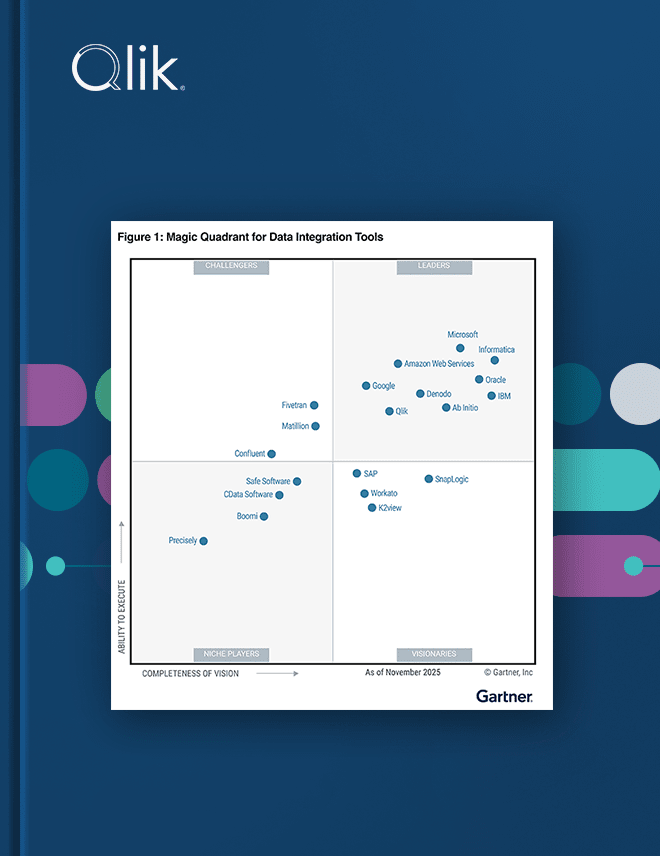
2025 Gartner® Magic Quadrant™ for Data Integration Tools
For the 10th consecutive year, Qlik was recognized as a Leader in the 2025 Gartner® Magic Quadrant™ for Data Integration Tools. Learn why in this complimentary report.

Speed time to analytics
The traditional multi-month, error prone ETL development to set up a data warehouse — typically 60 – 80% of prep time — often means your data model is out of date before the BI project even starts.
To speed time to analytics, you need to streamline data warehouse creation and management lifecycle.


Take a modern approach to data warehousing
Qlik Compose automates designing the warehouse, generating ETL code, and quickly applying updates, and leverages best practices and proven design patterns. You can dramatically reduce the time, cost, and risk of BI projects, on-premises or in the cloud.


In an era where the timeliness of information can make or break a business, Qlik Replicate and Qlik Compose meet our needs for real-time data acquisition and rapid analysis.

We cut 45 days of ETL coding to two, reduced implementation costs 80%, and accelerated DW updates to once monthly from twice annually.
Automate and streamline your data warehouse
with intelligent software
Dramatically reduce time, costs, and risks of data warehousing
Quickly design, create, load and update data warehouses
Automatically generate ETL to reduce time, costs and risks
Implement best practices and templates for more effective BI projects
Reduce dependence on highly technical development resources
Automatically generate end-to-end workflows from data ingest to report generation

Enjoy intuitive and guided workflows
Load and sync data with ease. Source feeds are loaded in real time with change data capture (CDC).
Automate data model design and source mapping. Data models can be created or imported, then modified and enhanced iteratively.
Streamline data warehouse and ETL generation. ETL code is auto generated to populate and load data warehouses.
Deploy data marts without manual coding. Data mart types are selected from a broad array of options including transactional, aggregated, or state oriented.

Optimize the data warehousing process
Workflow Designer and Scheduler: Run data warehouse and data mart ETL tasks as a single, end-to-end process. Schedule the execution of workflows to align with business and IT processes.
Lineage and Impact Analysis: Automatically create metadata during design phases or implementation. Re-generate data lineage when changes are implemented.
Monitoring and Notification: Monitor the status of all automatically generated tasks and workflows. Send proactive status alerts.
Data Profiling: Validate data before it is loaded by identifying and repairing format issues and discrepancies.
Data Quality: Configure and enforce pre-loading rules to automatically discover and remediate issues with values, formats, data ranges, and duplication while also implementing exception policies.

DataOps for analytics with smart data warehouse software
Get real time, analytics-ready, and actionable data to an analytics environment, from Qlik to Tableau, Power BI and beyond.


Frequently Asked Questions (FAQs)
Dimensional modeling is a data-warehouse design technique that organizes data into facts (measurable business events) and dimensions (the descriptive context around them), optimized for fast, intuitive analytical queries. Popularized by Ralph Kimball, it structures data the way business users think about it — by metrics and the attributes they slice by — rather than for transactional efficiency. Star and snowflake schemas are the common ways to implement it.
Kimball and Inmon are two classic approaches to data warehouse design. The Kimball approach builds from the bottom up using dimensional models organized around business processes, prioritizing fast delivery and ease of use. The Inmon approach builds from the top down, first creating a centralized, normalized enterprise warehouse and then deriving data marts from it, prioritizing consistency and a single source of truth. Many modern warehouses blend elements of both.
The data warehouse lifecycle is the end-to-end set of stages involved in building and running a warehouse — gathering requirements, designing the data model, generating and loading data through ETL or ELT, deploying, and continuously maintaining and updating it as sources and needs change. Traditionally each stage required heavy manual coding, which made warehouses slow to build and hard to change. Automation aims to streamline the whole lifecycle so warehouses can be delivered and evolved far faster.
A staging area is an intermediate storage zone where data is temporarily held after being extracted from source systems and before it's transformed and loaded into the data warehouse. It provides a place to cleanse, validate, and combine data without affecting either the sources or the warehouse itself. Using a staging area improves reliability and makes complex loads easier to manage and restart if something fails.
A data warehouse is a central repository designed to store integrated, historical data from across an organization for reporting and analysis. Unlike the databases that run daily operations, it's optimized for complex queries over large volumes of data and organized by business subject, giving everyone a single, consistent source of truth. It typically holds cleaned, structured data that has been modeled in advance for analytics.
Data warehouse automation is the use of metadata- and model-driven software to automate the stages of building and running a data warehouse — from design and code generation to loading, deployment, and maintenance. Rather than hand-coding every table and ETL job, teams define their intent in a model and the software generates the underlying structures and pipelines. This makes warehouses much faster to build, easier to change, and far less error-prone.
Data modeling is the process of designing how data will be organized, connected, and stored so it can be used effectively. It defines the entities, their attributes, and the relationships between them, acting as a blueprint before anything is physically built. In data warehousing, the chosen model — such as dimensional or data vault — shapes how well the warehouse performs and how easily it adapts to change.
A star schema is a common data warehouse design with a central fact table holding business measures, surrounded by dimension tables that describe those measures — forming a star shape. Its deliberately simple, denormalized structure keeps queries fast and easy to understand, which is why it's a staple of BI and reporting. It contrasts with the more normalized snowflake schema, trading some storage efficiency for query simplicity.
Data vault is a data-modeling methodology built for flexibility and auditability, using three building blocks — hubs for business keys, links for the relationships between them, and satellites for descriptive, time-stamped detail. This modular design makes it easy to add new sources and preserve full history without redesigning the whole warehouse. Its repeatable patterns also make it well suited to automation and to regulated industries that need strong traceability.
A data mart is a smaller, focused slice of a data warehouse built for a specific team or subject area, such as finance or sales. By narrowing the scope to what a particular group needs, it delivers faster queries and simpler self-service analytics than querying the full warehouse. Data marts are often organized with dimensional structures like star schemas for ease of use.
