REAL-TIME DATA ANALYTICS
Deliver Quick, Actionable Insights with Qlik's Real-Time Data Analytics Platform
Drive quick decisions with live data insights and real-time analytics. Stream, analyze, and visualize data as it happens to empower your business with current intelligence and automated responses.
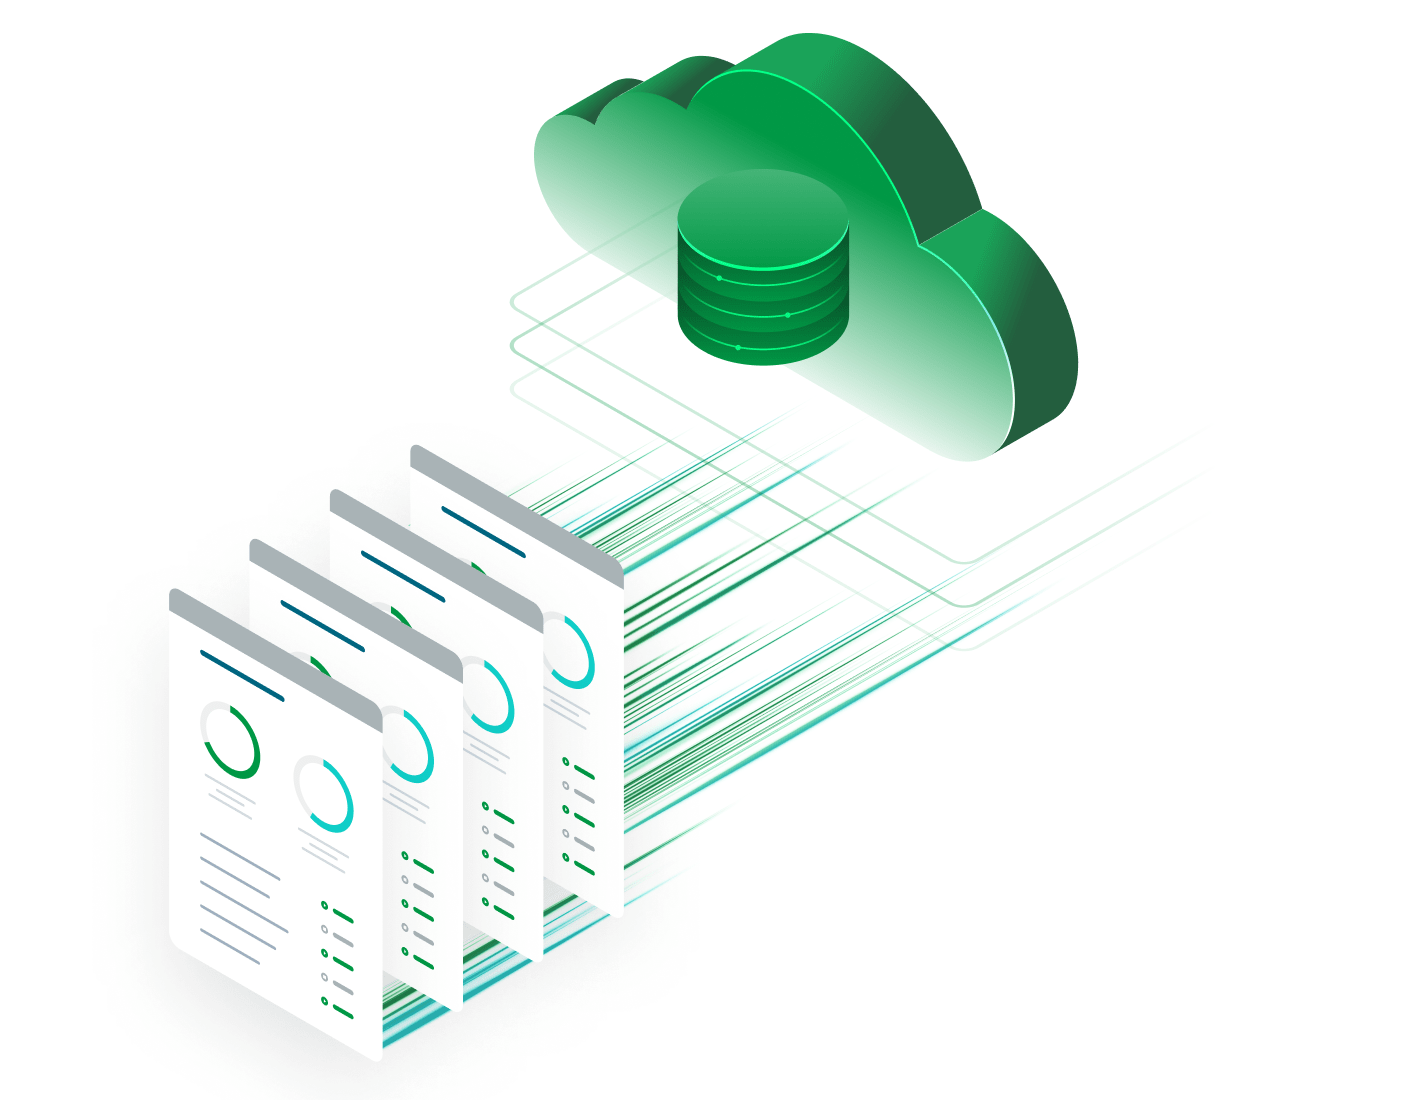
Turn streaming data into smarter, faster decisions
Transform live data streams into immediate business value with real-time analytics that combines continuous data processing, interactive visualization, and automated alerting to keep you current on events.

Capture, process, and visualize data as it happens
Ingest and analyze streaming data from IoT devices, applications, and business systems with minimal latency, enabling immediate insight into operations, customer behavior, and market conditions.

Automate alerts and business responses in real time
Trigger automated actions, notifications, and workflows based on real-time data conditions, enabling proactive responses to opportunities and threats as they emerge.

Empower teams with live, self-service analytics
Provide business users with current dashboards and ad-hoc analysis capabilities that don't require waiting for batch processing or IT intervention to see the latest data.
How does Qlik's real-time data analytics platform work?
Step 1 - Connect to live data sources and streams
Step 2 - Process and transform data in motion
Step 3 - Visualize and analyze insights instantly

Why Qlik real-time data analytics?

React to opportunities faster than competitors
Make decisions based on current reality rather than historical data, enabling you to capitalize on fleeting opportunities, respond to threats immediately, and outpace competitors.

Connect to data anywhere in your architecture
Analyze streaming data regardless of where it originates—whether in public clouds, private data centers, or edge locations—with unified real-time processing across your infrastructure.

Handle millions of events per second reliably
Process massive data volumes with horizontally scalable architecture that maintains consistent sub-second latency even as event rates spike during peak business periods.
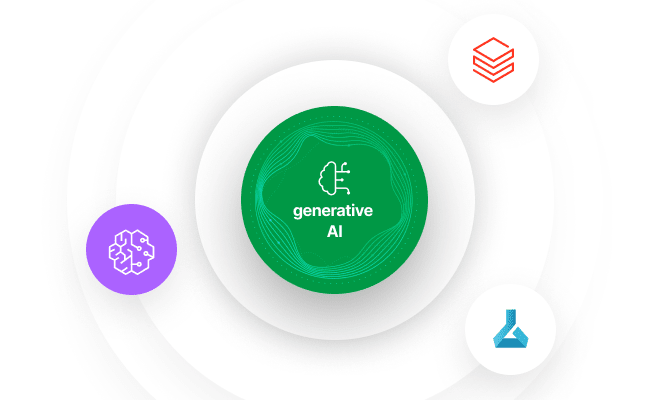
Combine real-time data with machine learning
Apply trained AI models to streaming data for real-time predictions, anomaly detection, and automated recommendations that enhance human decision-making with intelligent assistance.

Trusted for mission-critical real-time operations
Join organizations across industries that rely on Qlik's real-time analytics to monitor operations, serve customers, detect fraud, and optimize processes with always-current intelligence.
Key capabilities of Qlik's real-time data analytics platform

Continuous data streaming and event processing
Ingest data from thousands of sources simultaneously with event-driven architecture that captures, routes, and processes data streams in real time without batching delays.
Real-time dashboards and visual analytics
Create interactive visualizations that automatically update as new data arrives, providing always-current views of business metrics, operational KPIs, and performance indicators.

Automated alerting and workflow triggers
Configure intelligent alerts based on complex conditions, thresholds, and patterns that notify stakeholders and trigger automated responses when critical situations require attention.

AI-enhanced predictive and anomaly detection models
Deploy machine learning models that continuously analyze streaming data to predict outcomes, identify unusual patterns, and recommend actions in real time.

Integration with Qlik Cloud, BI tools, and APIs
Connect seamlessly with Qlik's analytics ecosystem and third-party platforms through REST APIs, webhooks, and native connectors that extend real-time capabilities across your technology stack.

Enterprise-grade security, scalability, and governance
Protect streaming data with encryption, access controls, and audit logging while maintaining the performance and reliability required for business-critical real-time operations.
Trusted by leading enterprises worldwide


What our customers say


We started an automation process with Qlik and now we only have half the people managing reports. The other half is doing activities allowing us to leapfrog the competition by providing even more proactive analytics vs. reactive.


Connect to 500+ data sources with Qlik’s analytics integrations

SAP

Adobe

IBM

AWS

MySQL

Jira

Azure

MS SQL

Apache

Mongo DB
SAP
Adobe
IBM
AWS
MySQL
Jira
Azure
MS SQL
Apache
Mongo DB
SAP
Adobe
IBM
AWS
MySQL
Jira
Azure
MS SQL
Apache
Mongo DB
SAP
Adobe
IBM
AWS
MySQL
Jira
Azure
MS SQL
Apache
Mongo DB
SAP
Adobe
IBM
AWS
MySQL
Jira
Azure
MS SQL
Apache
Mongo DB

Oracle

Salesforce

Workday

Apache Iceberg

CircleCI

Zendesk

Snowflake

Databricks


OpenAI

Intuit
Oracle
Salesforce
Workday
Apache Iceberg
CircleCI
Zendesk
Snowflake
Databricks
OpenAI
Intuit
Oracle
Salesforce
Workday
Apache Iceberg
CircleCI
Zendesk
Snowflake
Databricks
OpenAI
Intuit
Oracle
Salesforce
Workday
Apache Iceberg
CircleCI
Zendesk
Snowflake
Databricks
OpenAI
Intuit
Oracle
Salesforce
Workday
Apache Iceberg
CircleCI
Zendesk
Snowflake
Databricks
OpenAI
Intuit
Resources


Real-time data analytics FAQs
We use in-memory stream processing, distributed architecture, and optimized data structures that enable sub-second latency even when processing millions of events per second across multiple data streams.
Yes, our platform provides REST APIs, JDBC/ODBC connectivity, and native integrations with leading BI platforms, enabling you to embed real-time data into existing dashboards and reports.
We support configurable windowing strategies and watermarking that handle out-of-order events while maintaining result accuracy, with options to reprocess data when late arrivals significantly impact analysis.
Our platform includes checkpoint recovery and replay capabilities that automatically resume from the last processed position when connections are restored, preventing data loss during disruptions.