QLIK COMPOSE® FOR DATA LAKES
Data Lake Automation Software for Faster Delivery

Automate analytics ready data pipelines
Create analytics-ready data sets by automating data ingestion, schema creation, and continual updates.

KEY RESOURCE
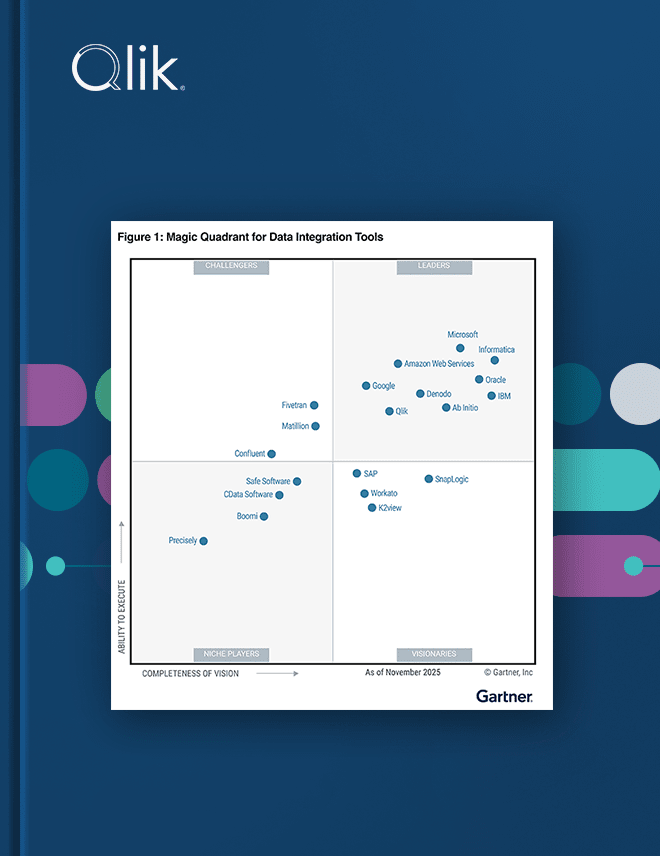
2025 Gartner® Magic Quadrant™ for Data Integration Tools
For the 10th consecutive year, Qlik was recognized as a Leader in the 2025 Gartner® Magic Quadrant™ for Data Integration Tools. Learn why in this complimentary report.

Easy data structuring and transformation
Build, model and execute data lake pipelines with an intuitive guided user interface
Automatically generate schemas and Hive Catalog structures for operational data stores (ODS) and historical data stores (HDS) without manual coding

Get continuous updates
Be confident that your ODS and HDS accurately represent your source systems
Use change data capture (CDC) to enable real-time analytics with less administrative and processing overhead
Efficiently process initial loading with parallel threading
Ensure only transactions completed within a specified time are processed, using time based partitioning and transactional consistency

Generate cost effective low latency views of live data
Merge the latest unprocessed changes in the change table (including the last open partition), on Read.
Optimize compute by creating live views, both ODS and HDS, without processing changes every time

Generate analytics specific data sets from a full historical data store (HDS)
Automatically append new rows to HDS as data updates arrive from source systems
Automatically time-stamp new HDS records, to create trend analysis and other time oriented analytic data marts
Support data models that include Type-2, slowing changing dimensions

How Qlik Compose for Data Lakes works
Get real time, analytics-ready, and actionable data to an analytics environment, from Qlik to Tableau, Power BI and beyond.


Frequently Asked Questions (FAQs)
A data lake is a centralized repository that stores large volumes of data in its raw, native format — structured, semi-structured, and unstructured — until it's needed. Because it doesn't require data to be structured or modeled up front, it's flexible and cost-effective for storing diverse data at scale, and it's widely used for data science, machine learning, and big data analytics. The trade-off is that without good management, a data lake can become disorganized and hard to use.
Data lake automation is the use of software to automate the complex, repetitive work of building and maintaining a data lake — ingesting data from many sources, transforming it, and keeping it continuously updated and analytics-ready. Instead of hand-coding pipelines and manually managing schema changes, automation generates and maintains them from metadata and rules. This speeds delivery, reduces errors, and frees engineers from tedious pipeline maintenance.
A data swamp is a data lake that has become disorganized, poorly documented, and untrustworthy, so people can no longer find or rely on the data it contains. It happens when data is dumped in without proper cataloging, quality control, metadata, or governance. Avoiding a data swamp is exactly why data lakes need structure, cataloging, and quality management from the start.
Schema-on-read is an approach where data is stored in its raw form and structure is applied only when the data is read or queried, rather than when it's written. This is characteristic of data lakes and offers great flexibility, since you don't have to define a schema up front and can interpret the same data in different ways. It contrasts with schema-on-write, used by data warehouses, where data must conform to a defined structure before it's stored.
Data lakes are commonly organized into zones that represent stages of refinement. A raw or landing zone holds data exactly as ingested; a cleansed or refined zone holds validated, standardized data; and a curated or consumption zone holds analytics-ready datasets shaped for business use. This layered structure — sometimes labeled bronze, silver, and gold — keeps a lake organized and helps prevent it from turning into a data swamp.
Data pipeline automation is the practice of using software to automatically build, run, and maintain data pipelines rather than hand-coding and manually managing each one. It can generate pipeline logic, adapt to schema changes, schedule and monitor runs, and recover from errors with little human intervention. Automation makes data delivery faster, more consistent, and far easier to scale as the number of pipelines grows.
A data pipeline is a set of connected, automated steps that carry data from its sources to a destination, transforming and validating it along the way. Each stage hands off to the next — for example, ingesting raw data, cleaning it, reshaping it, and loading it into a lake or warehouse. Pipelines can run on a schedule in batches or continuously in real time, and they're what keep analytics and AI systems fed with usable data.
Data ingestion is the first step in a data pipeline, where data is collected from source systems and brought into a storage or processing environment such as a data lake or warehouse. It can happen in batch, loading data in scheduled chunks, or in real time, streaming records as they're created. Reliable ingestion is essential because everything downstream depends on getting complete, timely data in the first place.
A data warehouse stores structured data that's been cleaned and modeled in advance for specific reporting and analytics, applying its schema before data is loaded. A data lake stores raw data of any type in its native format and applies structure only when the data is read, making it cheaper and more flexible for data science and machine learning. Warehouses excel at fast, reliable answers to known questions, while lakes support open-ended exploration across diverse data — and many organizations use both.
A data lakehouse adds a metadata and table layer on top of low-cost data lake storage, giving it warehouse-grade features like reliable transactions, schema enforcement, and fast queries. The result is a single platform that can support both BI and machine learning on the same data, avoiding the need to maintain separate lake and warehouse systems. It aims to combine the flexibility and low cost of a lake with the performance and trust of a warehouse.
AI-ready data is data that has been prepared to the standard machine learning and AI systems need — clean, well-structured, properly labeled or tagged, governed, and current. Because models learn from and act on their inputs, gaps, errors, or bias in the data flow directly into unreliable results. Getting data to this state typically takes significant integration, cleansing, and cataloging work, which is why automating it has become a priority for AI initiatives.

