Data Insights
Definition, examples and best practices. This guide provides a definition, examples and practical advice to help you gain insights from data that will help your business.
What are Data Insights?
Data insights refers to the deep understanding an individual or organization gains from analyzing information on a particular issue. This deep understanding helps organizations make better decisions than by relying on gut instinct.
Related terms:
- Actionable data insights refers to insights that are specific and relevant enough that they lead to actions which can increase efficiency, revenue and profits.
- Active intelligence refers to having in-the-moment awareness about every aspect of your business from real-time data designed to trigger immediate insights and actions.

Don’t just measure. Measure what matters.
Download the KPI Planning Guide to learn:
- 10 steps to strong KPIs
- Which questions help you define your KPIs
- 170 KPI examples and templates
Differences Between Data, Analytics & Insights
Here we define the terms data, analytics, and insights and examine the differences between them.
What is Data?
Simply put, data is a collection of facts, representing measurements or descriptions of a specific situation. These facts can be in the form of numbers, symbols or words and are typically stored digitally.
Raw data, also known as source data or primary data, is facts and figures in the original form and organization that they were collected from the source. Given how much of our lives happens digitally today, organizations have an abundance of raw data on hand. For data analysis to take place, this raw data must be transformed into clean, business ready information through a process known as data integration.
What is Analytics?
Analytics is the use of tools and processes to combine and examine sets of data to identify patterns, relationships and trends. The goal of analytics is to answer specific questions, discover new insights, and help organizations make better, data-driven decisions.
The best data analytics tools enable users to freely explore big datasets that combine relevant data from multiple sources. In this way, users not only answer the specific questions they started with but they discover new questions to ask.
What are Insights?
The broad definition of insight is a deep understanding of a situation (or person or thing). In the context of data and analytics, the word insight refers to an analyst or business user discovering a pattern in data or a relationship between variables that they didn’t previously know existed. This can have a thrilling, “aha moment” aspect to it.
What are the Differences?
The differences become clear when we crystalize the definitions:
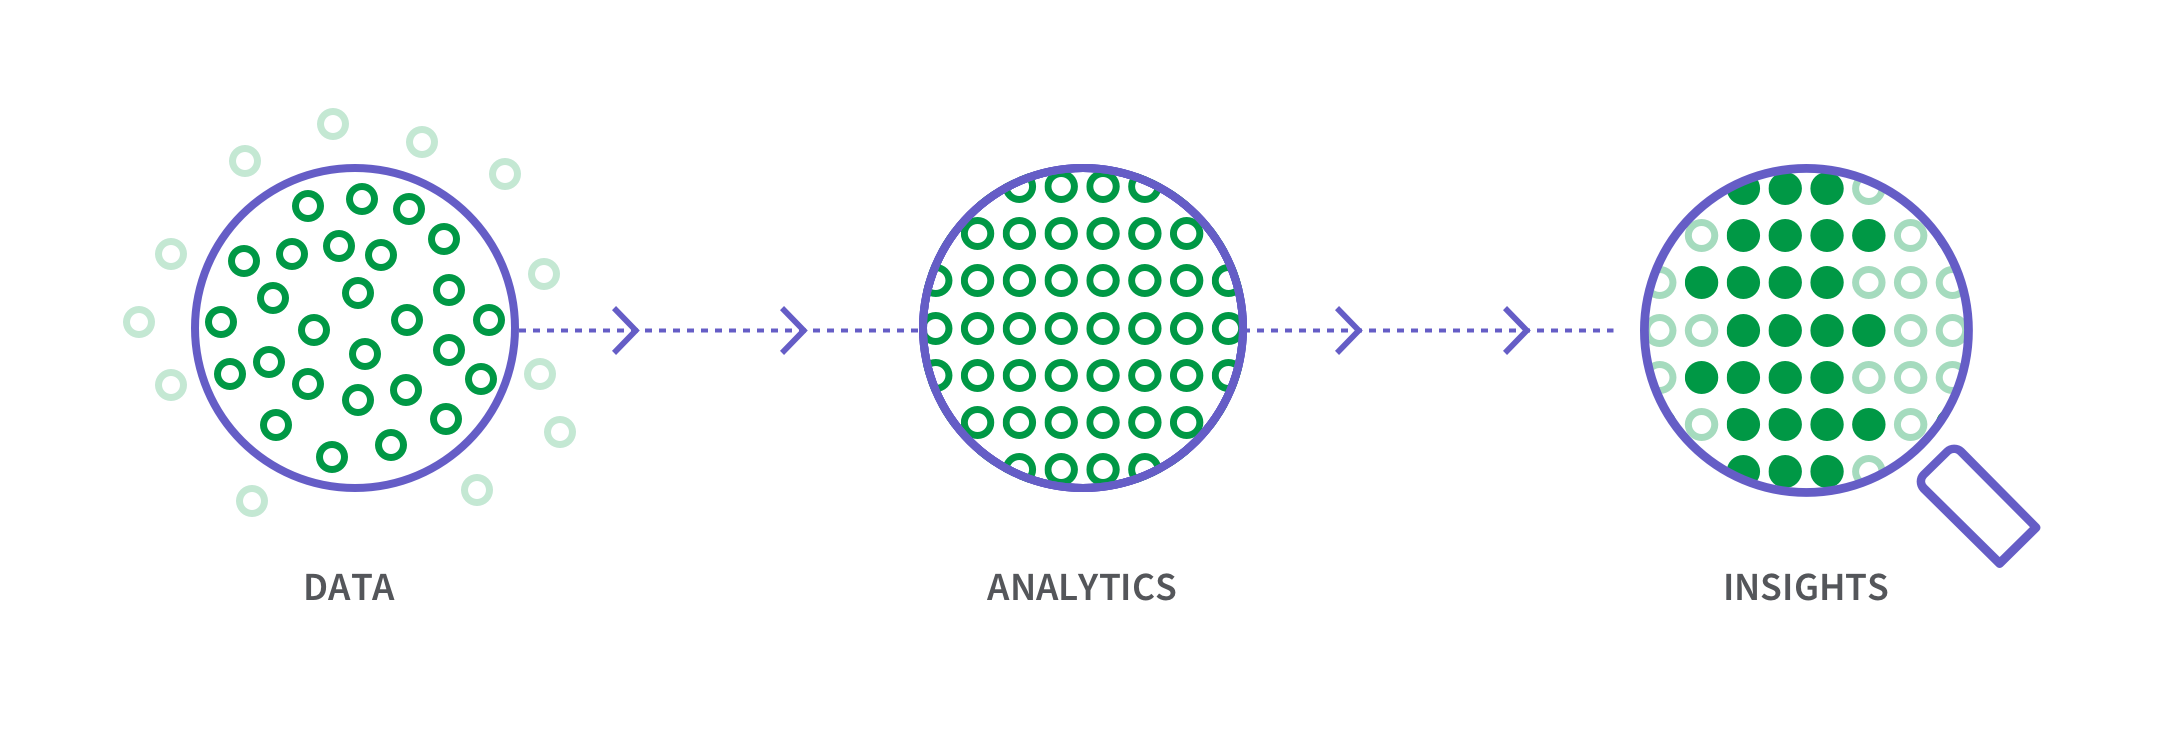
Data = a collection of facts.
Analytics = organizing and examining data.
Insights = discovering patterns in data.
There’s also a linear aspect to these terms that differentiates them. Data is collected and organized, then analysis is performed, and insights are generated as follows:
Data Insights Examples
Data insights will vary between industries and departments of organizations. Still, below are four key data insights examples which can apply to many teams.
Data insights that:
- Optimize processes to improve performance.
- Uncover new markets, products or services to add new sources of revenue.
- Better balance risk vs reward to reduce loss.
- Deepen the understanding of customers to increase loyalty and lifetime value.
Let’s use the last one, deeper customer understanding, to give a more specific data insights example…
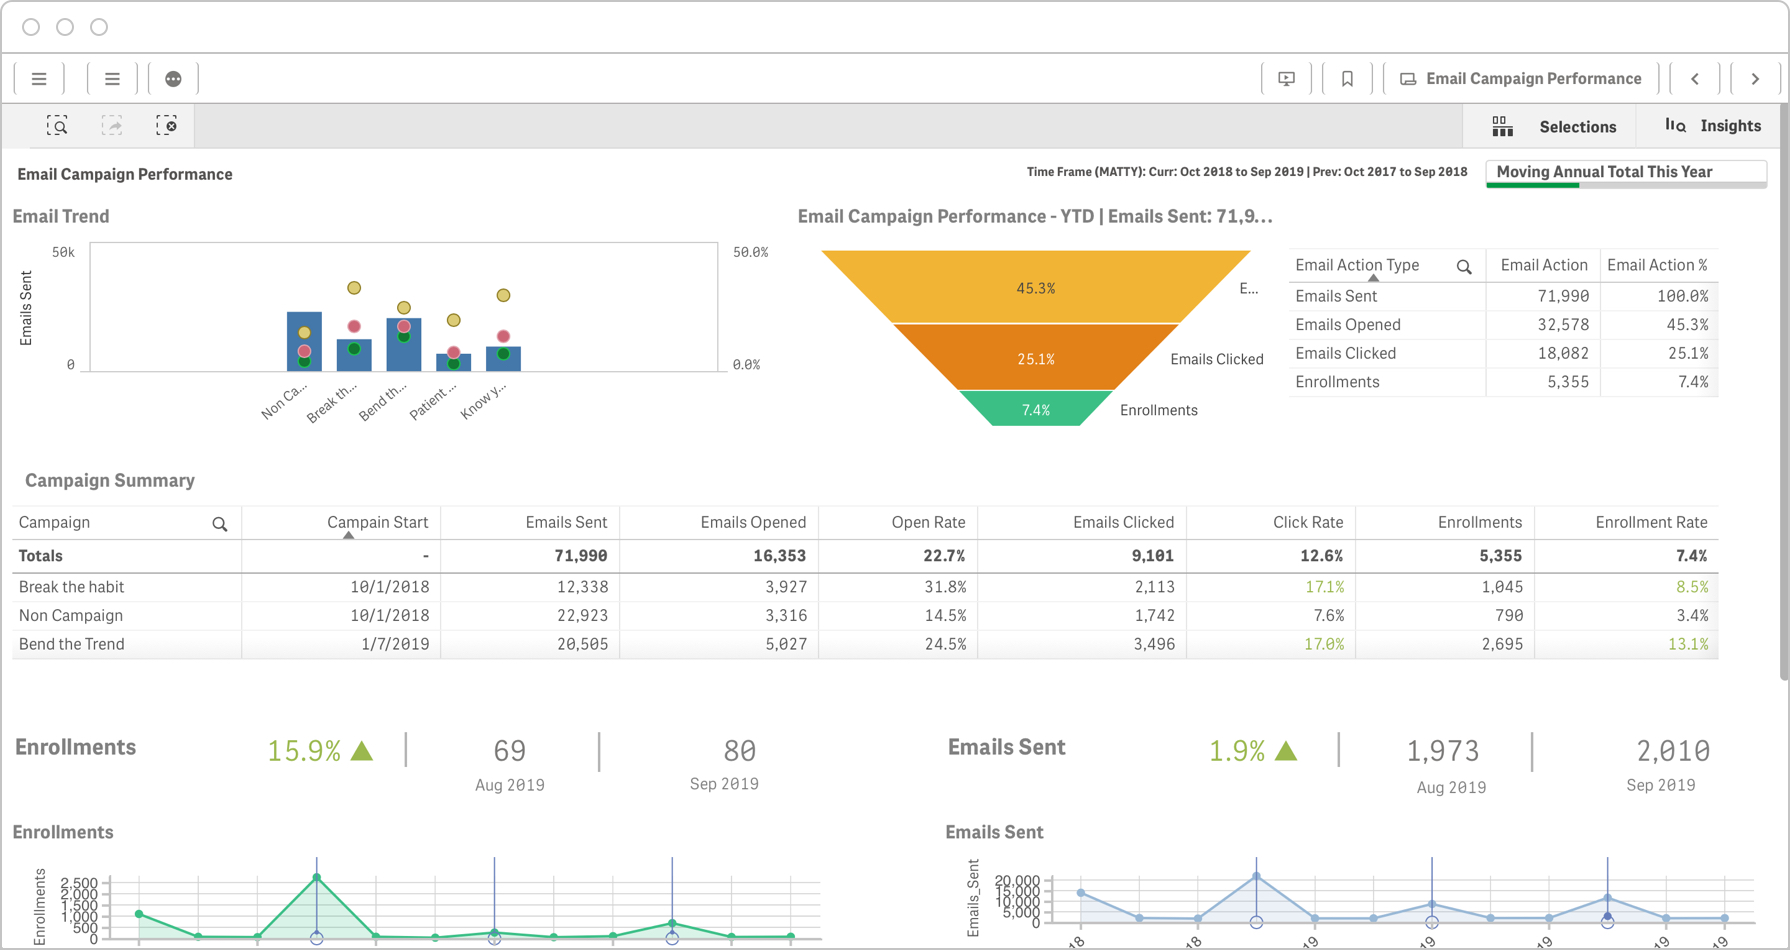
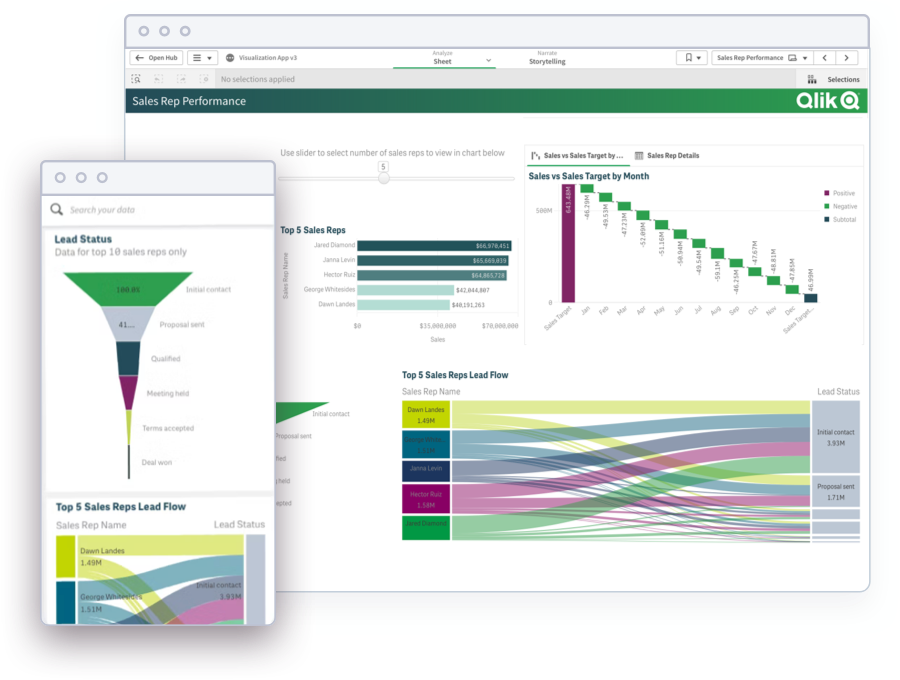
Campaign Optimization Example
A marketing team can collect data of different email campaigns and use data analytics to gain insights on which one resonates best with their customers. The marketing dashboard below provides an in-depth view of the conversion funnel for email campaigns. The data insight in this case is that the “Bend the Trend” campaign has the highest enrollment rate, which is the primary key performance indicator for this team.
10 Ways to Take Your Visualizations to the Next Level
How to Get Data Insights
The process to obtain actionable data insights typically involves defining objectives, collecting, integrating and managing the data, analyzing the data to gain insights and then sharing these insights.
1) Define business objectives
Stakeholders initiate the process by clearly defining objectives such as improving production processes or determining which marketing campaigns are most effective, like in the example above.
2) Data collection
Ideally, systems have already been put in place to collect and store raw source data. If not, the organization needs to establish a systematic process to gather the data.
3) Data integration & management
Once collected, source data must be transformed into clean, analytics-ready information via data integration. This process includes data replication, ingestion and transformation to combine different types of data into standardized formats which are then stored in a repository such as a data lake or data warehouse.

4) Data analysis
Data analytics software or BI tools allow users to explore the data and collaborate with others to develop data insights that answer specific questions. Users can then share their findings via dashboards and reports. Some modern tools offer self-service analytics, which enables any user to analyze data without writing code. This capability promotes data literacy, which means that more users can work with and get insights from their data. Here are three key aspects of modern analysis tools that lead to greater data insights:
Data visualization and dashboards
Augmented analytics

Embedded analytics
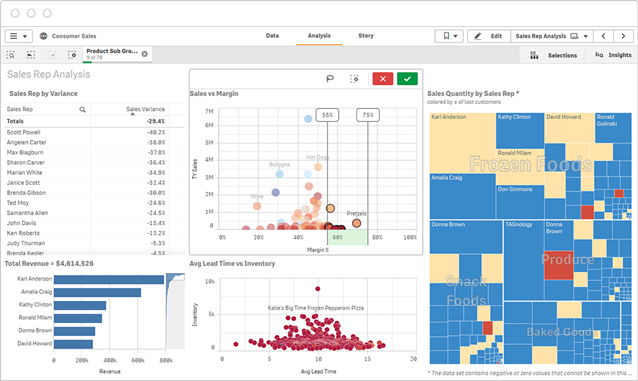
Modern Analytics Demo Videos
See how to explore information and quickly gain insights.
- Combine data from all your sources
- Dig into KPI visualizations and dashboards
- Get AI-generated insights