Business Intelligence (BI) Tools
2022 reviews of top BI software. This guide provides an in-depth comparison of the top BI tools and practical advice to help you select the right solution for your organization.
What Are Business Intelligence (BI) Tools?
Business intelligence tools are software and SaaS applications that inform business decisions by bringing together and processing data from a variety of sources. Modern BI tools support use cases for users of all skill levels such as interactive dashboards, data visualization, augmented analytics, and embedded analytics.
Power BI vs Tableau vs Qlik – The 3 Gartner Leaders
In the 2023 Gartner Magic Quadrant BI report, only three vendors were named as Leaders: Qlik, Power BI and Tableau. Here we take a deep dive in comparing the three Leaders on the most important criteria when evaluating business intelligence software.
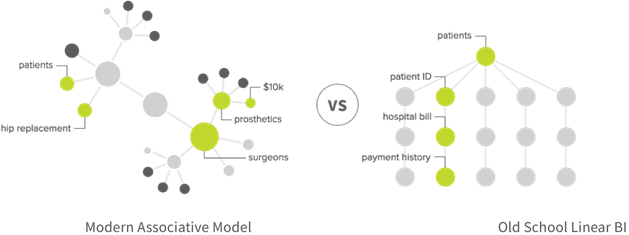
Fully Interactive Dashboards
Many BI tools can create pretty dashboards. Your tool should allow end-users to freely explore all your data, in any direction, directly from within the dashboard. This lets you uncover connections you might not have queried or just couldn’t find at all with a query-based BI tool.
-
Qlik
Qlik’s data engine is "associative" in that it lets users explore all data freely, on the fly, and from any angle. Plus, machine learning allows Qlik’s cognitive engine to get smarter over time – giving you ideas of where to explore.
-
Power BI
Power BI works on a SQL database that restricts users to linear, predetermined query paths within a narrow slice of data. In any given query, only part of your data is analyzed, leaving key patterns and connections undiscovered.
-
Tableau
Tableau also operates over an old school query-based approach which restricts users to follow specific paths and limited data. And in Tableau, exploration only happens in the beginning of the process, before the final dashboard, so end users are not explorers.
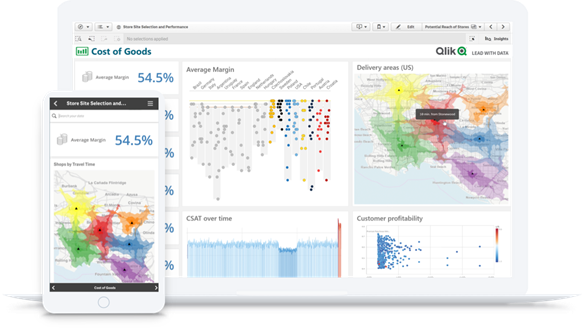
Data Visualization
Visualizing data in graphs, charts and maps makes it easier for stakeholders to understand and engage with. The best tools go further by using AI to automatically reveal the shape of your data, pinpoint outliers and even suggest new visuals.
-
Qlik
Qlik offers you a full range of interactive visualizations and makes them uniquely powerful by compressing large data sets, revealing the shape of your data and pinpointing outliers, and providing AI assistance for chart creation, association recommendations, and data preparation.
-
Power BI
Power BI offers a full range of visualizations. While these visualizations are interactive, you will be limited in your filtering and exploration by preselected query paths.
-
Tableau
Tableau also offers a full range of visualizations. In fact, this is what Tableau is best known for. But as with their dashboards, you’ll be limited in your filtering and exploration by query paths that the author selected.
Dashboard & BI Tools Comparison Kit
Essential resources for selecting the best BI and dashboard tool for your organization, including an evaluation checklist, a TCO comparison report and analyst findings.
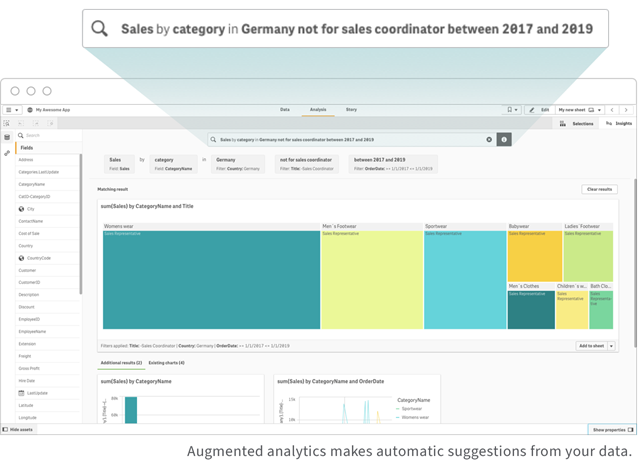
Augmented Analytics
Augmented analytics amplifies the power of human intuition with the scale and speed of machine intelligence, raising the data literacy of every user and increasing efficiency.
-
Qlik
Qlik includes a full range of AI capabilities across different users and use cases which are built into the platform at a foundational level. Qlik's approach to AI is to have an always-on engine within the context of the analysis that the user is performing to suggest insights and new connections as you explore your data.
-
Power BI
Power BI added Microsoft AI which brings two features, Quick Insights and Q&A. These are objects on a dashboard and need to be included by the user. As usual, accessing these features requires you to purchase the whole Microsoft stack.
-
Tableau
Tableau’s Ask Data feature is also a “bolt on” in that it’s not core to the platform. This means it doesn’t work with the business logic built into workbooks because it can’t access workbooks. It connects only to data sources, which means it can’t leverage the insight your analysts have built.
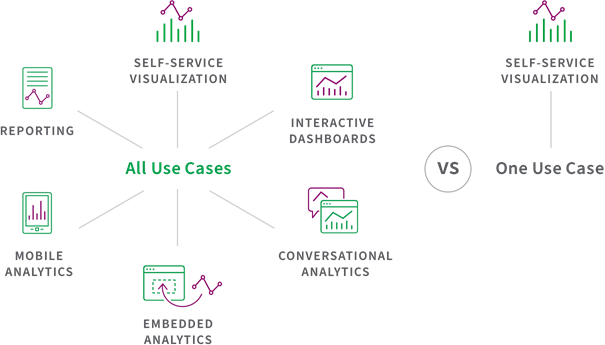
Broad Use Cases, One Platform
Business intelligence tools should support many use cases--like exploring data, embedding analytics, or creating interactive dashboards--for many different types of users, such as analysts, engineers and businesspeople. The best BI tools should allow all users to carry out all BI use cases using the same platform and data.
-
Qlik
All users in your business can perform all activities on the same platform with a common analytics engine, AI capabilities and analytics data pipeline.
-
Power BI
Multiple Microsoft products are required to deliver on a range of common use cases. Again, Power BI requires you to invest in the full Microsoft stack.
-
Tableau
Tableau is primarily an authoring environment for analysts to create data visualizations.

Governed self-service
Top BI tools should allow you to keep your data and content under control without limiting self-service discovery. They should have a centralized management capability that uses rules-based governance to control publishing, sharing and user access to apps and data. Because you want data, analytics and insights everyone can trust.
-
Qlik
All content creation on Qlik happens in the cloud, where it’s governed and controlled at every step. Qlik centralizes and unifies your data, creating governed data models with robust data security. Plus, governed libraries provide reuse and standardization for analytics.
-
Power BI
With Power BI’s decentralized approach, your data is spread across people’s desktops and the cloud. Managing data properly when it’s all over the place can be expensive and time-consuming.
-
Tableau
Tableau allows for multiple copies of content with only minor iterations to please each individual. Managing these different copies requires work, which means cost.
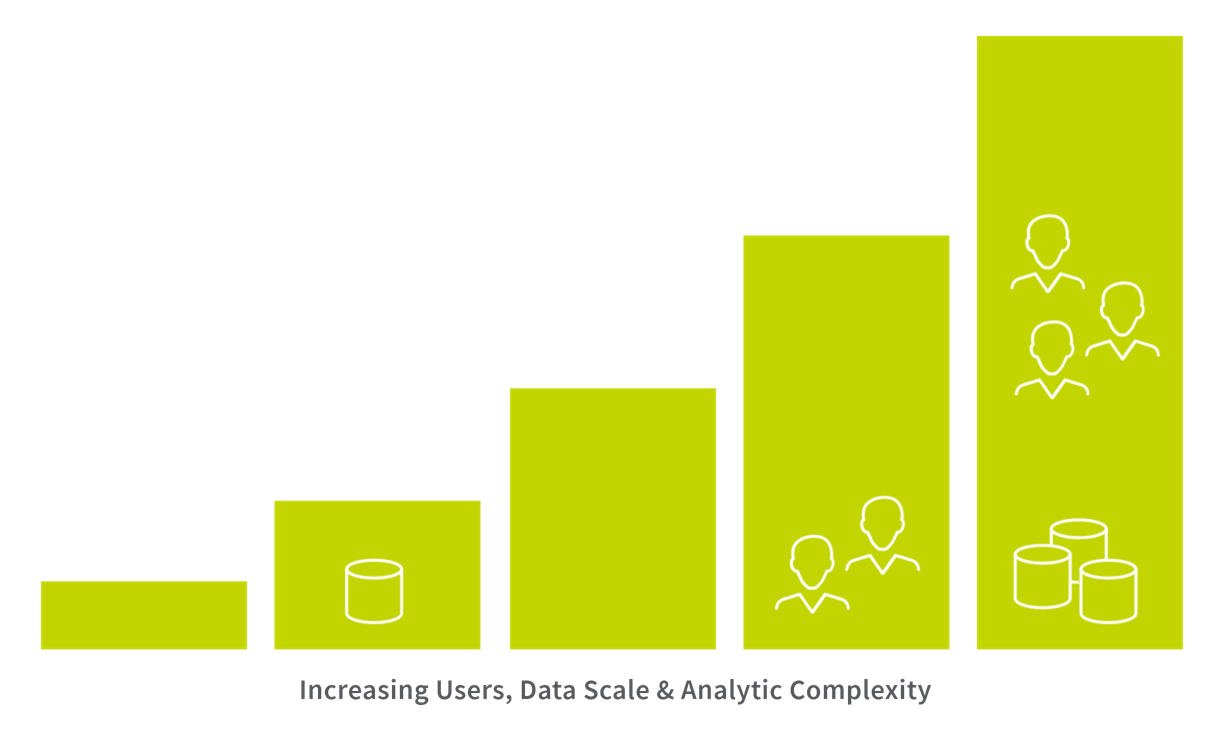
Scalability
Uncovering insights works best when users have a complete, up-to-date view of all relevant data. This requires business intelligence tools to integrate and combine data from any source, as close to real-time as possible. To do that successfully, you need BI software that’s built to handle data at any scale without compromising performance or driving up costs.
-
Qlik
Qlik’s unique associative engine provides instant calculation performance, even with massive data sets, real-time data and high numbers of users. And thanks to Qlik’s ability to add, modify and remove records, you can keep data fresher in a much smaller build window.
-
Power BI
Power BI makes you spend for scale. Once you hit the cheaper Power BI Pro’s shockingly low data limits (1GB per data set), you’ll need to switch to Premium. Or live query, which will slow your work (and everyone else’s) to a crawl.
-
Tableau
Tableau’s engine slows dramatically in attempts to handle large volumes of disparate data, especially when paired with complex analytics. And you cannot increment data and keep it fresh in small build windows.

Mobility
No matter where you are or what device is closest, you need a platform that lets you freely explore data and uncover hidden insights whenever inspiration (or curiosity) strikes.
-
Qlik
Qlik Sense is built for mobility. Responsive design and touch are native to the platform. Qlik offers a full-native mobile app with fully interactive online and offline exploration and integrated alerting with push notifications.
-
Power BI
The Power BI mobile app only allows for viewing, not creating and Power BI’s cloud is mainly used for uploading reports. Because on the Power BI platform, desktops reign supreme – and you’ll need different desktop software for different tasks.
-
Tableau
On mobile, Tableau allows you to download one sheet from a broader workbook. You can’t filter; you can only highlight one value at a time and scroll to see where that value shows up in related charts.
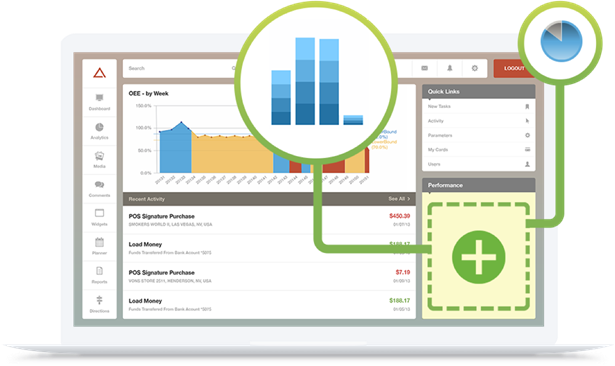
Embedded analytics
Building a competitive edge comes from making new discoveries in every area of your business. But that only works if analytics are everywhere, too. The best BI tools should allow you to easily embed robust analytics to the applications, portals and processes your business runs on. This includes your entire enterprise ecosystem – so employees, suppliers, partners and customers alike can make better decisions faster than ever.
-
Qlik
With Qlik, you can embed a dashboard – and individual numbers, values, and metrics. So, you can embed analytics in your products, workflows, portals, and edge devices. Qlik’s API-first platform was built using modern standards to work with the latest web and application technologies, allowing you to extend functionality wherever you need.
-
Power BI
Power BI allows for embedding dashboards and objects. But despite Microsoft being a very developer friendly company, Power BI is not API-first and a lot of capabilities are not available in their SDKs.
-
Tableau
Tableau can embed a dashboard, but that’s all. Its APIs are notoriously limited, which means your options for embedding and extending your analytics are seriously limited, too. Without these essential capabilities, it is becoming increasingly difficult to meet the massive rise in demand for insights across most organizations today.
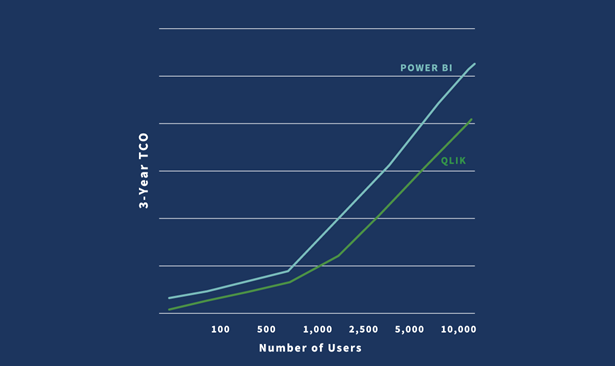
Total Cost of Ownership
Many companies only consider the initial purchase price when choosing business intelligence software. But total cost of ownership (TCO) is much more than that. From buying the software and infrastructure, to deployment and integrations, to support and maintenance, some platforms demand a much bigger financial – and time – commitment.
-
Qlik
Qlik has no hidden or additional costs and your total cost of ownership is lower than Power BI or Tableau.
-
Power BI
Power BI may seem low-cost on the surface. But to work at enterprise scale, you have to pay for an upgrade. Learn more.
-
Tableau
As you scale, Tableau will require additional investments.
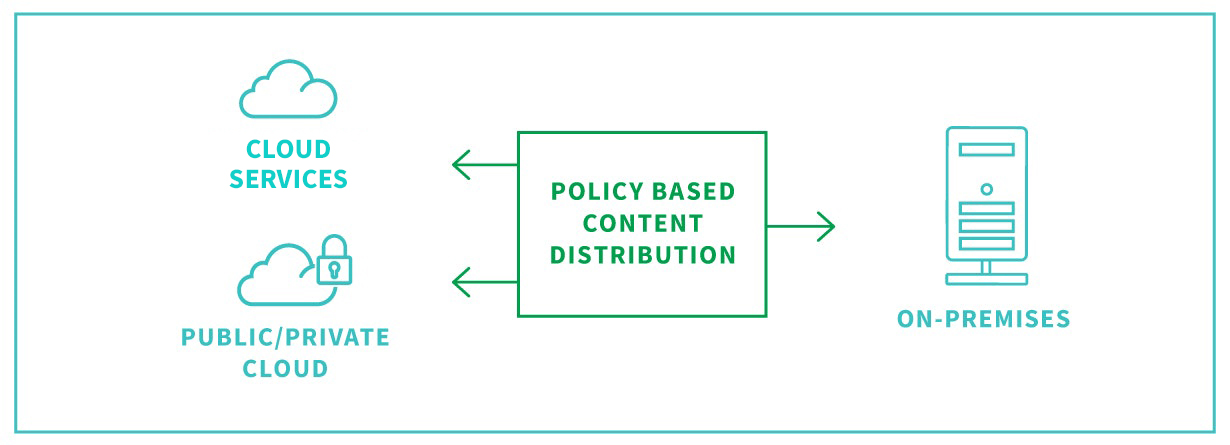
Flexible Cloud Strategy
Keep your cloud strategy flexible. Business intelligence tools should help you gain insights, not force you to build new infrastructure or limit your options. From on-premise to cloud hybrid, your BI software should have a platform-agnostic, multi-cloud architecture that enables you to deploy in any environment with unparalleled performance and scalability.
-
Qlik
Qlik provides a full enterprise SaaS environment as well as on-premise or private cloud options. And, Qlik is independent, offering you total freedom and control of your data.
-
Power BI
With Power BI, you’re required to use Azure – and only Azure. It simply won’t work with other cloud providers. But you will get some (unwelcome) variety: Power BI's on-premise functionality is different from their cloud experience.
-
Tableau
Now that Tableau answers to Salesforce, what does that mean for their customers’ data? Great question. If you’re evaluating Tableau, it’s time to start asking where your data could end up and whether it could get locked in.
Data Integration
Your business intelligence software will help you go further faster if it has end-to-end data integration and analytics. This is because a flexible and scalable data integration and analytics solution can put the power of insight into the hands of any user. Bringing these capabilities together as an integrated solution means you can quickly focus on maximizing the value of your data and analytics, not managing a complex technology stack.
-
Qlik
Qlik Sense has best-in-class Data Integration capabilities for combining and transforming data as well as data cataloging. Qlik also offers an enterprise class Data Integration platform which provides a seamless analytics data pipeline.
-
Power BI
Power BI is built on a patchwork platform designed to get you to keep adding Microsoft stack products. These additional products will cost you more.
-
Tableau
Tableau has data prep capabilities in Tableau Desktop and in Tableau Prep. But they solve different problems (although neither can solve all). So which do you use? And what do you use for the data problems Tableau can’t solve?

Data Literacy
Data literacy is the ability to read, work with, analyze and communicate with data. It’s a skill that empowers all levels of workers to ask the right questions of data and machines, build knowledge, make decisions, and communicate meaning to others.
-
Qlik
Data democracy: Qlik believes in true self-service. Our platform lets anyone, at any skill level, explore their data.
-
Power BI
Data dictatorship: With Power BI, only authors have self-service access. And once they’ve published content, it’s available only with very limited interactivity. If users want to explore deeper, they have to go back to the author for a new report.
-
Tableau
Tableau’s idea of discovery requires you to be an author. So their data literacy initiative is focused on authors only. That’s data literacy for data dictators that leaves the masses behind.
See full comparison
Analyst Perspectives On BI Tools
Compare the best business intelligence tools with these useful resources.
-
BARC’s BI & Analytics Survey 23: Qlik Highlights
BARC, a leading enterprise software analyst firm, talked to real BI users to analyze and compare leading BI and Analytics products. Users ranked Qlik Sense® #1 in Performance Satisfaction, Dashboards, and Project Length in its peer groups.
-
Cheers to 13 years!
Qlik has been named a leader in the Gartner® Magic Quadrant™ for Analytics and Business Intelligence Platforms for the 13th year in a row.
-
BI Tools Comparison Kit
This kit provides essential resources for selecting the best BI tool such as an evaluation checklist and a TCO comparison guide.
5 Key Steps To Evaluate BI Tools
Transforming your business into an insight-driven operation starts with a modern business intelligence tool, and choosing the right tool is critical for success. Not all BI tools are created equal. To make the right choice, organizations must consider how business intelligence will drive value, which users will be doing the driving, and the full spectrum of costs associated with deploying the solution.
Below are five key steps for evaluating and selecting the best BI tools:
1. Be specific about the ways in which analytics will drive value
Your best data insights will come once you make concrete decisions about what your organization is trying to achieve digitally. For example, you might be trying to democratize data and analytics by embedding them into operational apps or creating advanced analytics to support strategic decisions. The more specific your requirements, the easier you can frame selection criteria.
2. Identify which users REALLY are important
Users may include technical business analysts, data scientists; business users and managers, upper-level management, external clients and partners, customers, and even front-line customer service reps or warehouse personnel. Are they all important? They might be. The point is, be honest, identify which ones are, and then determine if the analytics platform can meet their needs…and use cases.
3. Go beyond TCO to recognize the costs of doing analytics wrong
Evaluating TCO is a critical factor in selecting a platform. But, when you select a business intelligence tool as a foundation to drive digital transformation in your organization, there are a multitude of hidden costs to consider. We’re not just talking about the usual hardware, software, support, training, and ongoing license/subscription fees.
We’re talking the REAL hidden costs…the ones that many vendors don’t want to discuss, such as “What’s it going to cost if repositories of visualizations are not available for reuse?” or “What’s the cost of purchasing and integrating complementary software when my data and visualizations can’t be packaged and deployed together within applications?” Learn more about the hidden costs of business intelligence software that cannot easily address your use cases.
4. Focus on business intelligence and analytics capabilities that deliver widespread value
Who cares if Platform A beats Platform B in 7 out of 10 features tested if the features do not align to the broad spectrum of specific use cases needed across your organization? This guide provides you with in-depth criteria to evaluate virtually any business intelligence use case.
5. Identify the capabilities needed to drive digital transformation
Before getting into feature/function discussions, make sure you’re considering business intelligence tools that offer a solid foundation to support data-driven digital transformation. At the core of this foundation is intuitive data access, robust governance, and broad deployment options. An effective BI tools comparison process will help you gauge the ability of any solution to effectively democratize data and drive data literacy throughout your business.
The BI Tool As A Holistic System
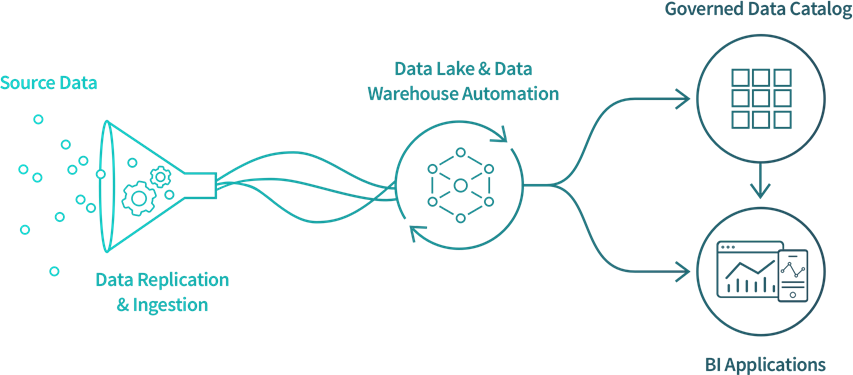
Data analytics alone is no longer enough. Modern business intelligence tools must close the gaps between data, insights and actions, to better inform decisions, drive actions, and propel business forward. This means taking a holistic approach, bringing together data integration, data analytics and data literacy.
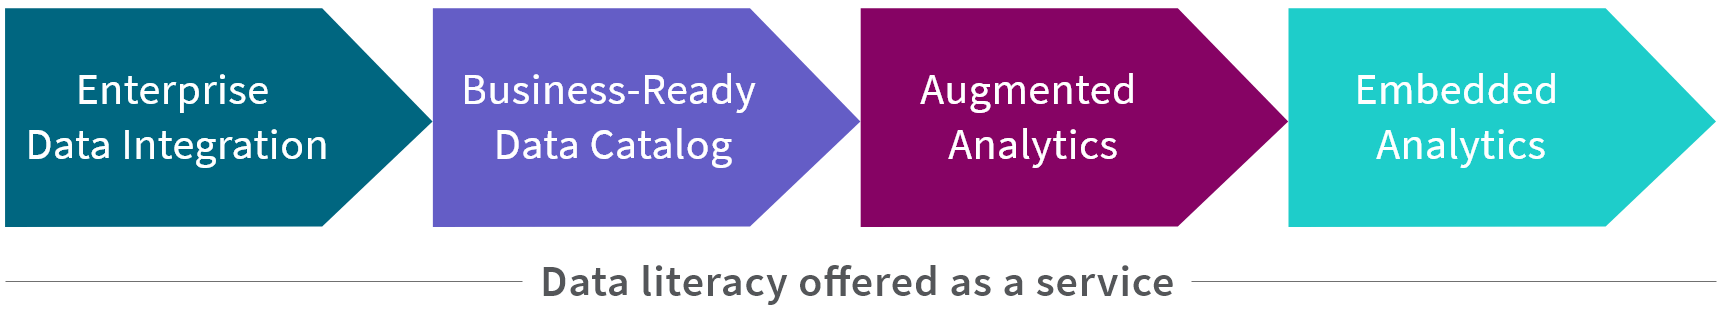
As shown above, business intelligence software should actually be a holistic system, starting with enterprise data integration to make all data universally accessible to all users. Then, a business-ready data catalog helps all users find this data. Augmented analytics helps users understand the data and embedded analytics helps all users take action on it. Finally, providing data literacy as a service helps all users trust and have the confidence to work with the data.
Let’s take a deeper look at each stage:
- Data Integration focuses on improving communication, integration and automation of data loads between business analytics consumers and the data teams. It’s about moving from raw to analytics-ready data in order to advance the speed and accuracy of analytics and improve productivity. By leveraging real-time data integration technologies such as change data capture and streaming data pipelines, the best BI tools change how data is shared and how it is made available across the enterprise.
- A data catalog provides actionable data, on-demand. This simplifies and accelerates an organization's ability to manage, prepare and deliver analytics-ready data to every business user across a diverse data landscape. Modern data catalogs optimize existing data assets and then curate, enrich and transform that data into business-ready information which can be made accessible to business users via a simple catalog and marketplace.
- Augmented analytics provides better insights, faster. The best BI tools seamlessly integrate with the data offerings mentioned above and enrich the human experience through AI rather than a black box approach. Qlik even offers self-service intelligent alerting and advanced statistical trending and outlier evaluation that immediately notifies users of material changes in the data.
- Embedded analytics put actionable analytics and data into the hands of people right where they make decisions. Modern business intelligence tools provide open API’s and an extensible platform.
- Data literacy offered as a service goes way beyond education on how to use a product. It strives to create a data-driven culture through a holistic approach that blends training, processes and technology to ensure customer success.
FAQs
-
They make it easier for business users to access, explore, and extract insights from an organization’s information assets by simplifying the process of connecting to, gathering, and profiling data from various business systems and other sources, and streamlining data preparation processes. They help users create data visualizations and rich analytics applications, as well as build and share reports and dashboards which are used to distribute actionable insights across the organization.
-
Business intelligence software helps by providing decision-makers with timely, accurate information and actionable insights about a business. This allows them to better understand customer behavior, track performance, detect market trends, discover emerging problems, and obtain greater visibility into all aspects of the business.