Business Intelligence (BI)

This guide helps you understand how modern business intelligence can help you gain actionable insights and make better, data-driven decisions.

What is business intelligence?

Business intelligence (BI) refers to the use of technology, tools, and processes to collect, analyze, and present business data for informed decision-making. It transforms raw data into meaningful insights, helping you to quickly identify trends, resolve problems, and grow revenue.

Modern BI tools leverage artificial intelligence (AI) and machine learning to automate analysis, unearth hidden patterns, and predict future trends, empowering you to make informed decisions faster.

How Business Intelligence Works

The traditional BI process required a lot of heavy lifting in terms of coding and manual analysis. Today’s top tools incorporate AI to enhance each aspect of business intelligence by automating processes, improving accuracy and efficiency, enabling advanced techniques, and generating insights and recommended actions.

Diagram showing workstream from data sources options to data collection and preparation to data analytics options to BI outputs

Let’s walk through the diagram above.

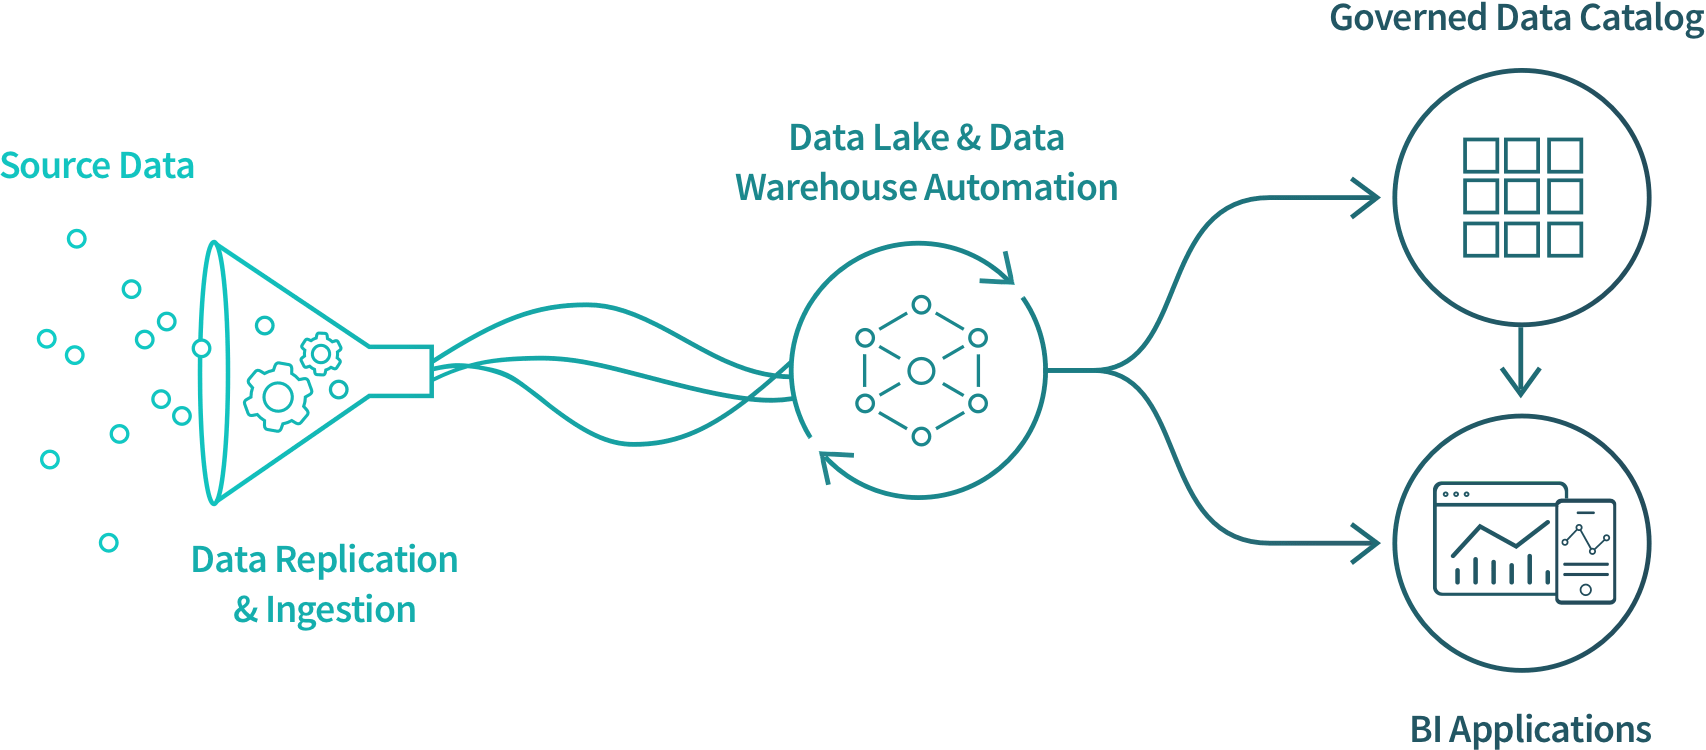
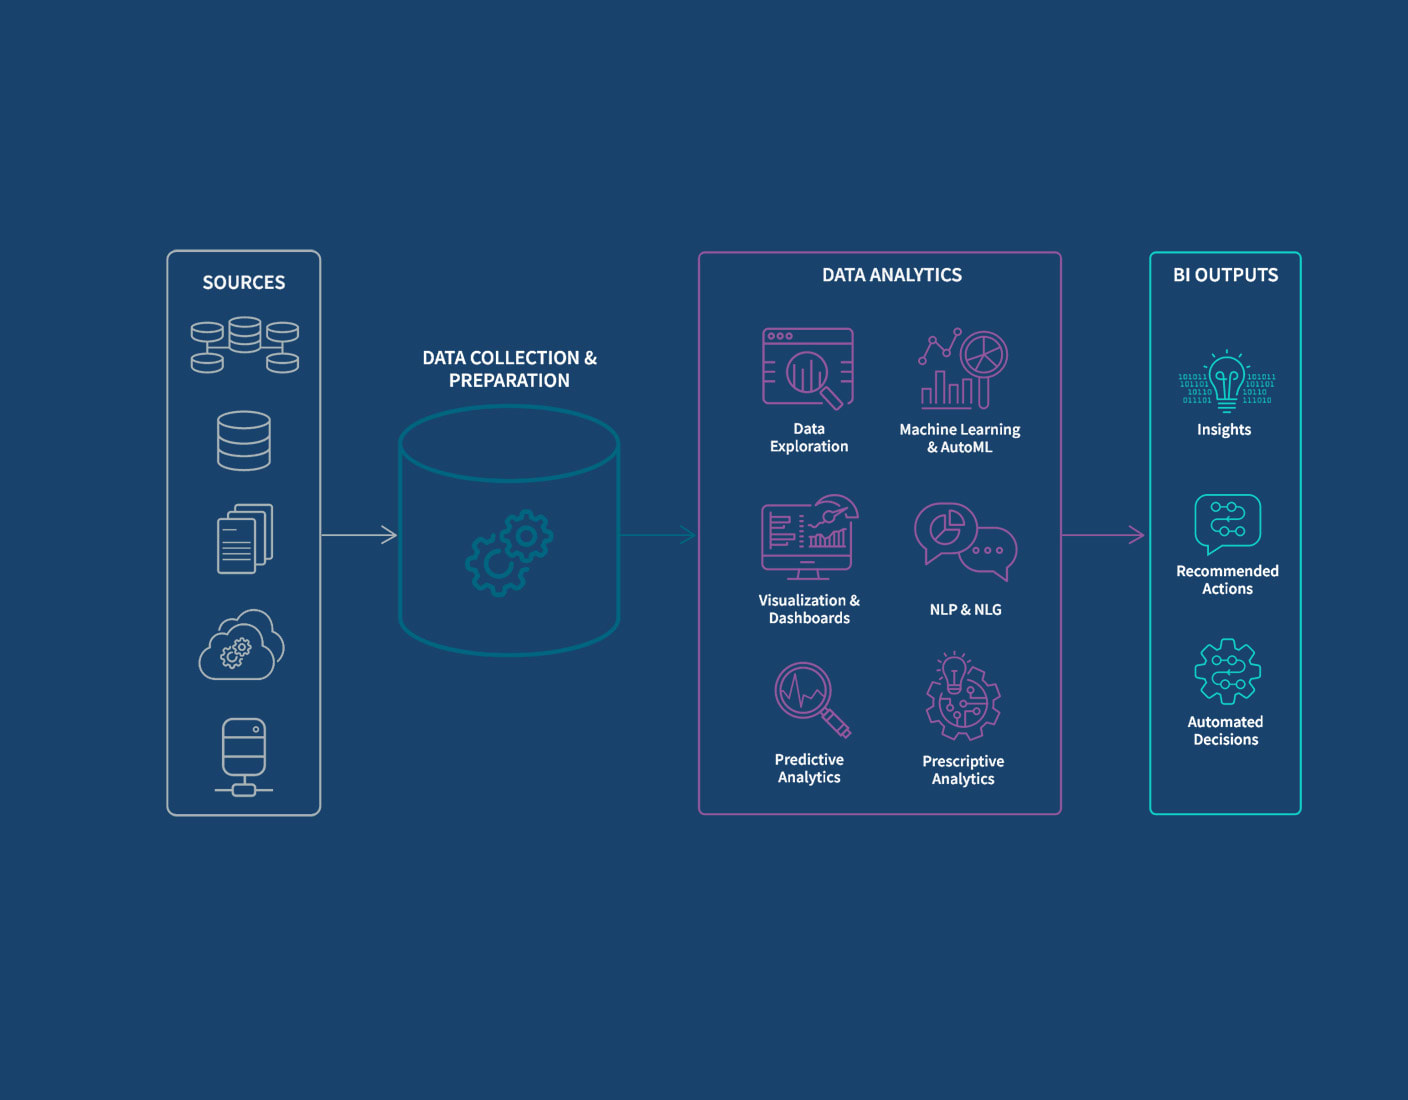
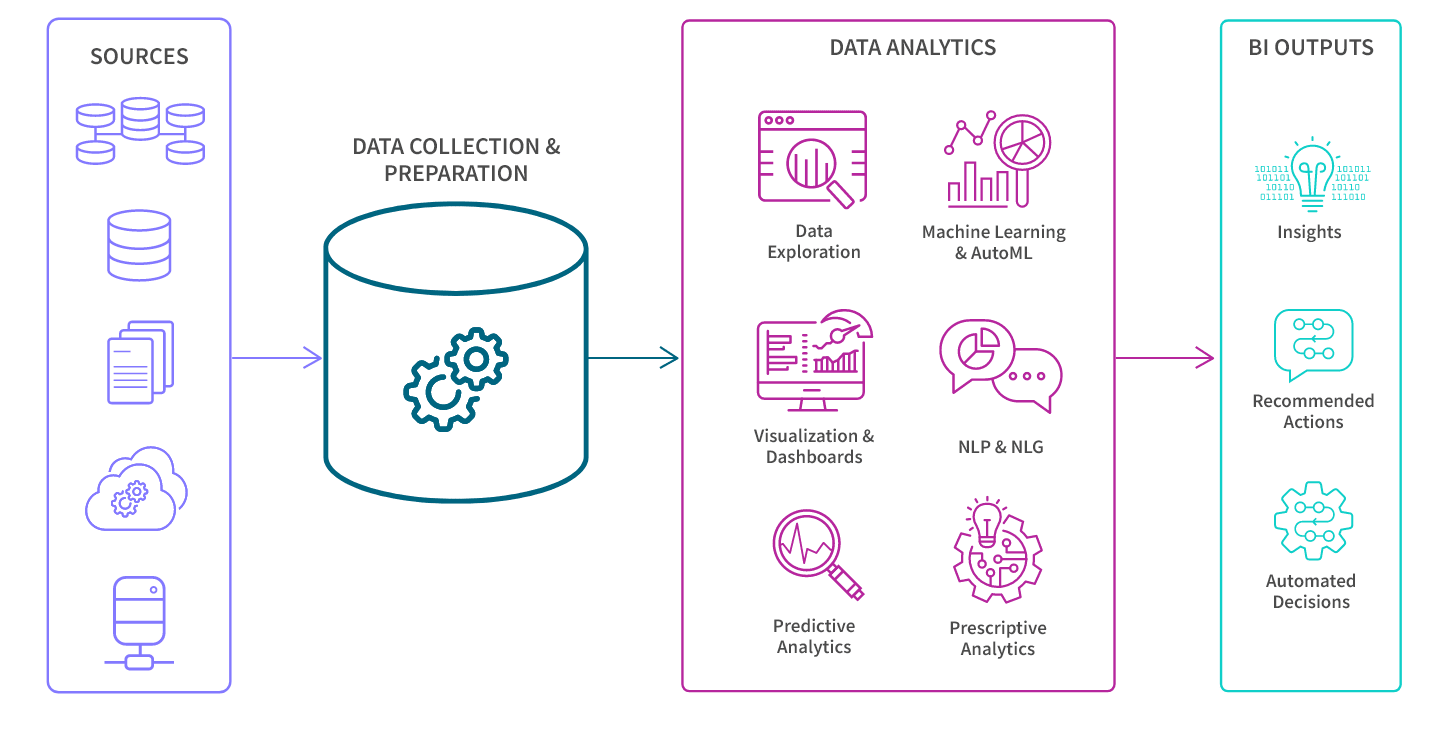
  1. Data is sourced from operational systems such as transactional, supply chain, and CRM applications. This can be historical data or real-time streaming data.

  2. This data is extracted, transformed, and combined into a repository such as a data warehouse or data lake, typically in the cloud. This data integration process gives you a comprehensive, unified view of your business and facilitates efficient data retrieval and analysis for BI purposes.

    • AI algorithms in modern BI improve the efficiency and accuracy of data preparation by analyzing large volumes of data to detect errors. 

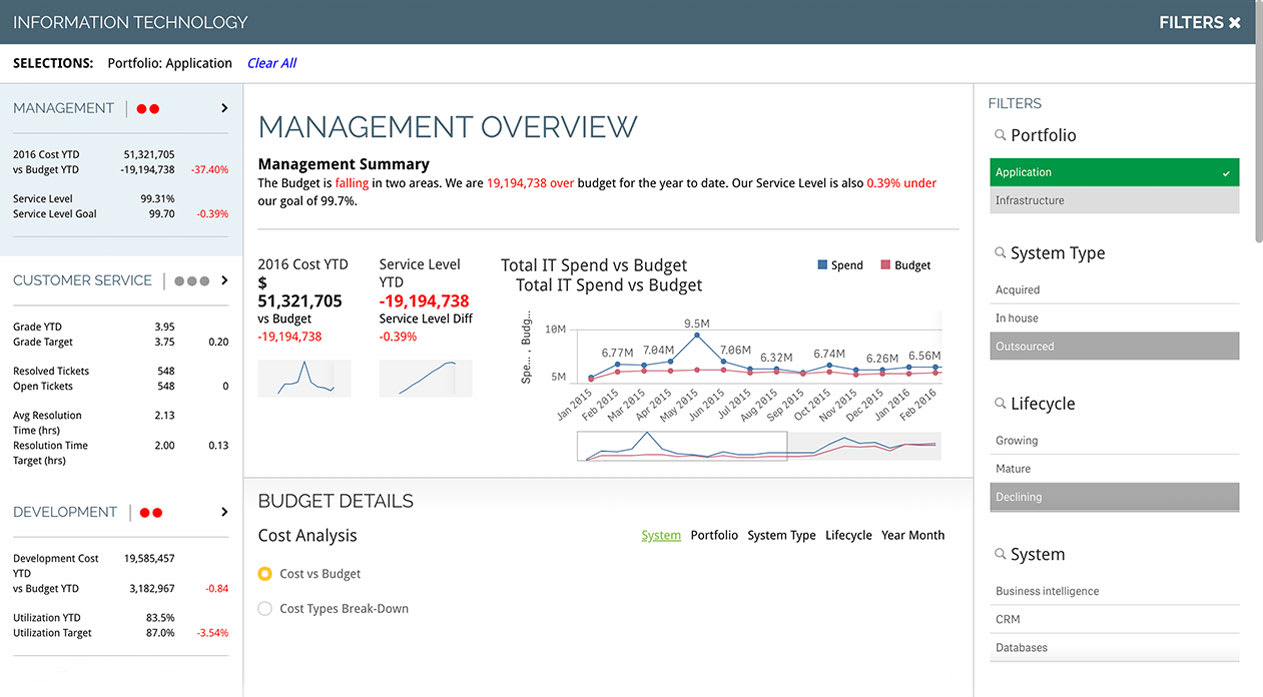
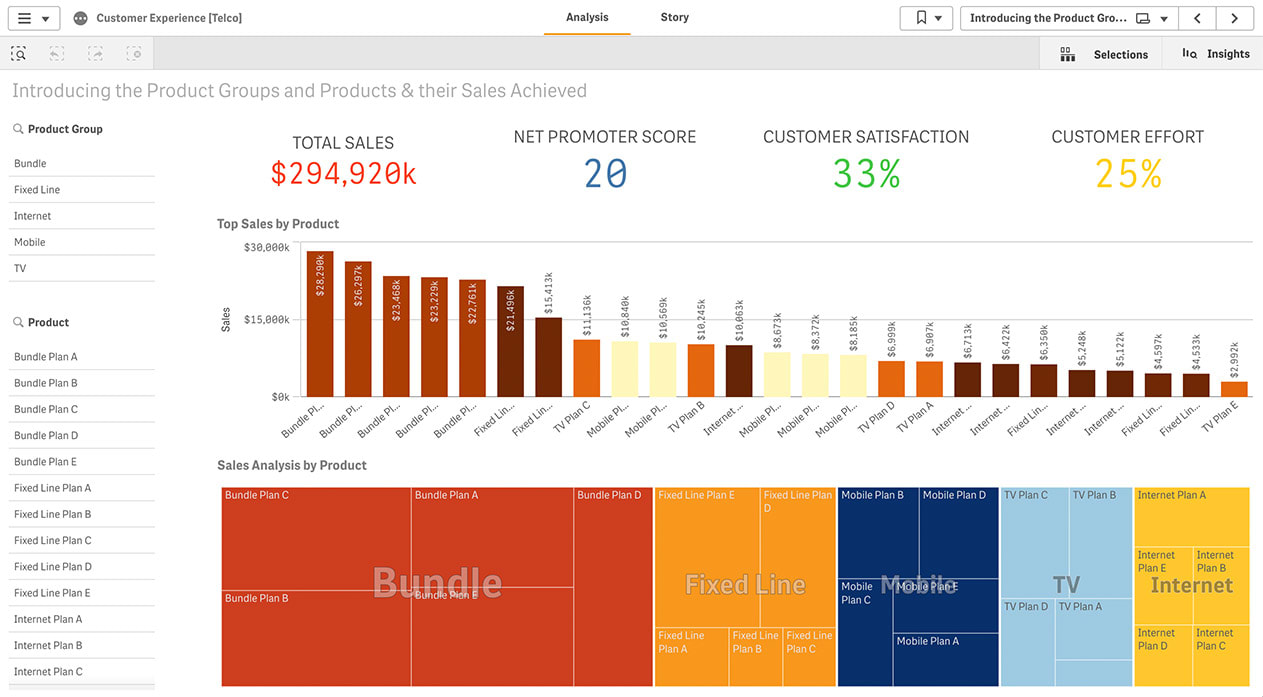
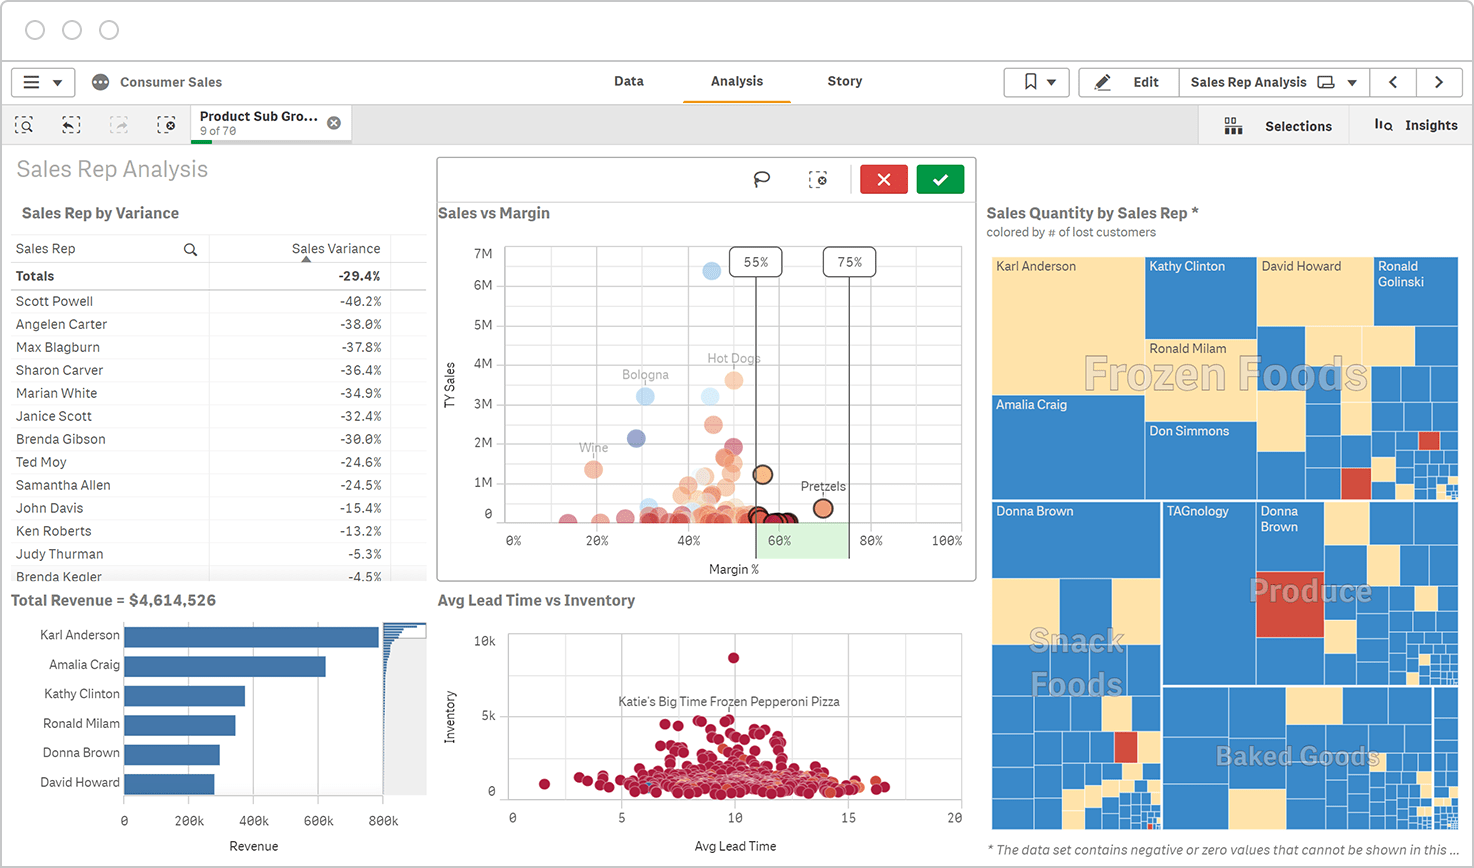
  3. Modern BI software makes it easy for you to use this data to perform different types of data analysis (sometimes referred to as business analytics), for example:

    • Find hidden patterns, trends, and valuable insights from large datasets through data mining and exploration.

    • Create interactive visualizations and dashboards which help you identify patterns and develop insights.

    • Build custom machine learning models without extensive training by leveraging AutoML.

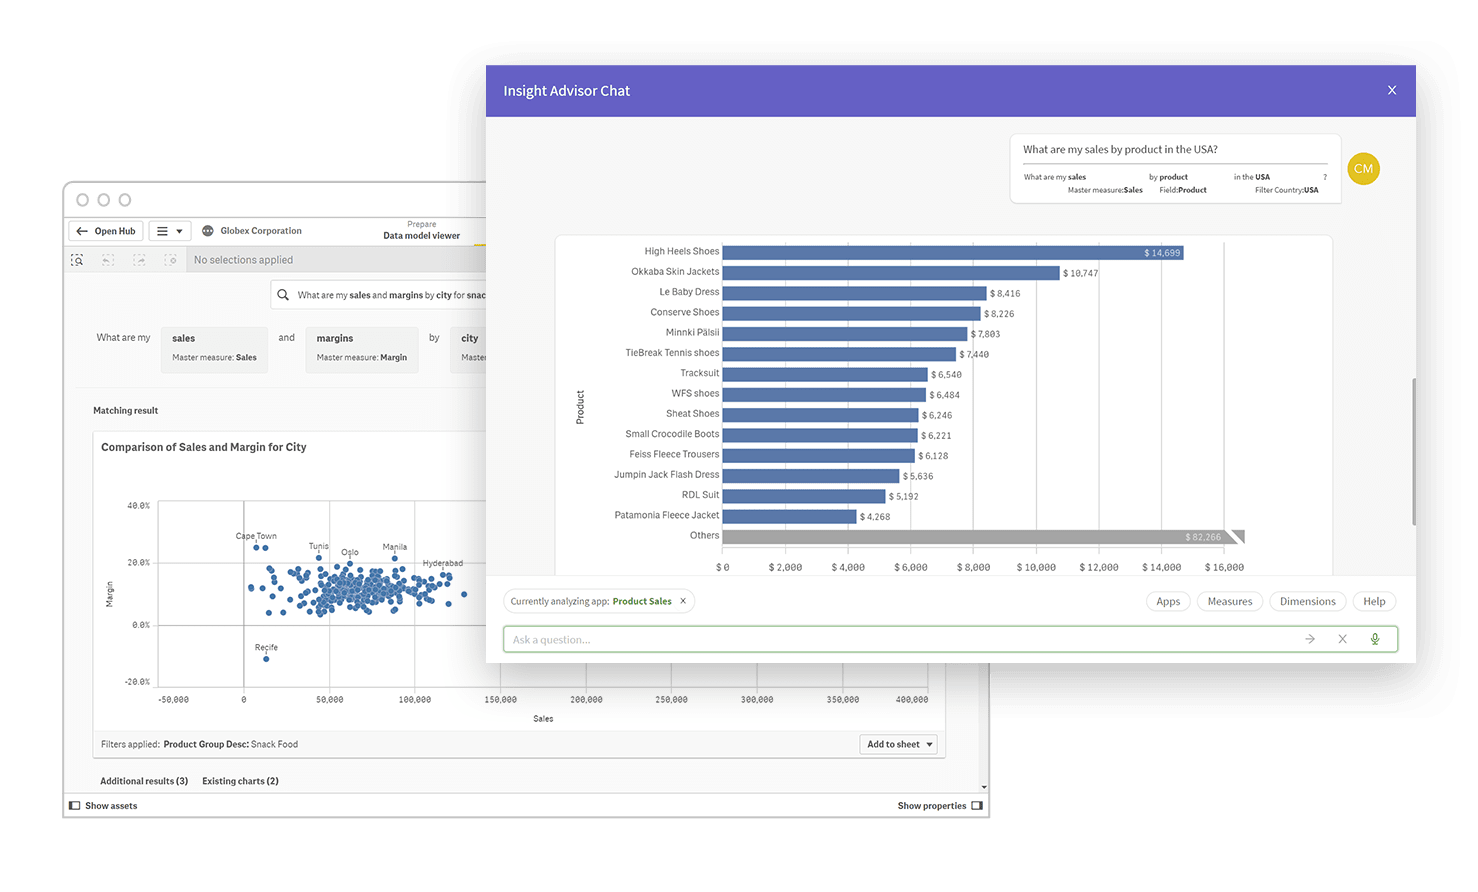
    • Chat with your BI tool and get immediate and understandable responses.

    • Use prescriptive and predictive analytics to make predictions about future outcomes.

  4. As before, the outputs are actionable insights to improve your business operations. But now, many of these insights, and even prescribed actions, are provided to you by AI. Plus, your BI software can be integrated into other systems and trigger alerts and actions automatically.

Benefits of Business Intelligence

According to BARC’s BI Survey, the top benefits of business intelligence software are improved data quality and faster, more accurate planning, data analysis and reporting. But how do these translate to real business value? 

Here are the five key ways BI can deliver value within your organization:  

Informed Decision-Making: BI provides timely and accurate insights, enabling you to make informed business decisions based on a thorough understanding of your data.

Improved Operational Efficiency: BI tools help streamline business processes by identifying inefficiencies, optimizing workflows, and facilitating data-driven improvements in operational efficiency.

Enhanced Data Visualization: BI platforms offer advanced data visualization capabilities, helping you to comprehend complex information through interactive dashboards, charts, and graphs.

Strategic Planning: BI supports strategic planning by providing a comprehensive view of key performance indicators (KPIs), market trends, and competitive intelligence, enabling you to align your strategies with business goals.

Competitive Advantage: By leveraging BI, organizations gain a competitive edge through quicker access to relevant information, proactive decision-making, and a better understanding of market dynamics, customer behavior, and industry trends.

Business Intelligence Tools

Modern BI supports a wide range of business needs and users, allowing every employee to access the insights they need, regardless of technical skill. Here are the primary capabilities of business intelligence solutions:

1. Artificial intelligence (AI) and Machine Learning (ML)

Now an essential part of business intelligence, AI and ML quickly process massive volumes of data to suggest relevant insights, automate processes, and let you interact conversationally. AI analytics complements human intelligence and increases data literacy so more users can get value from their data. And advanced Natural Language Generation (NLG) tools, enriched with machine learning capabilities, offer in-depth answers to complex queries.

2. Self-service BI

Gone are the days when you had to wait days or weeks for data scientists or data analysts to build reports. Self-service tools let you easily explore data and make discoveries using natural language search and interactive selections and create your own visual analytics with simple drag-and-drop tools. And AI is making these processes easier than ever.

3. Data Visualization

The ability to explore and interact with data makes it easier for you to explore, discover patterns, and gain insights from data. Interactive BI dashboards make data even more actionable, revealing the shape of the data, highlighting outliers and trends, and putting data in the ideal context to answer any question.

4. Custom & Embedded BI

Embedding BI into applications like CRMs and ERPs helps people find insights and deliver value faster, right where they work. BI technology that offers open APIs and developer tools lets you embed analytics, build custom BI apps, and create visualizations and extensions to address the ever-growing demands for insights.

5. Mobile BI

Work happens everywhere today. And to do your best work, you need access to BI insights whenever and wherever decisions are made. Mobile business intelligence lets you create and explore business analytics and collaborate using any device. The best mobile BI solutions support interactive analytics even when you’re offline.

6. BI Reporting

While BI reporting is one of the most traditional forms of business intelligence, it remains an essential BI capability. While many second generation BI tools don’t offer reporting, some offer highly flexible, modern reporting capabilities. This includes drag-and-drop report creation and formatting, pixel perfect output in popular formats and flexible automated delivery.

Icon of api stack and arrows showing extensibility
Icon of three people viewing a line graph on a screen

10. Data integration and data management

The most successful BI initiatives combine a smart business analytics strategy with an effective data strategy. Unstructured, raw data only gains value when it can be transformed into highly accessible, analytics-ready information. This often begins by moving source data (ERP, CRM, etc.) into a central repository like a data lake or data warehouse. Data connectors in the analytics system load big data from these repositories as well as specific applications and files so it can be prepared for use. This can be slow and tedious, requiring data experts which can create bottlenecks at scale. However, innovative data replication and data migration technologies can automate the integration process. In addition, governed data catalogs that profile and document every data source let you and other users easily access, create, and share data sets on your own, combining any data you need to analyze.

Diagram showing how data is processed into the Governed Data Catalog and BI Applications.

BI Tools Comparison Kit

Essential resources for selecting the best tool for your organization, including an evaluation checklist, a TCO comparison report and analyst findings.

Business Intelligence Best Practices

The History and Evolution of BI

BI has evolved in three major waves of innovation over the past six decades. We’re now in the third generation of BI and it holds the greatest potential to spread the value of BI to every business user and unlock all the value in your data.

Graphic depicting 1st generation, 2nd generation, and 3rd generation of Business Intelligence

1st Generation BI – Centralized

In the early days of BI, if you wanted to learn something from data, you had to submit a question to a data analyst or data scientist in IT with the skills to create an SQL query or use a complex technology stack that analyzed multi-dimensional data sets (OLAP data cubes). Often weeks later, you’d get excel spreadsheets that could be out-of-date or raised further questions. This inefficient “Ask > Wait > Answer” cycle limited BI’s value, while reaching only 25% of business users with static information.

2nd Generation BI – Decentralized

The next wave of BI introduced user-driven BI. This replaced the complex technical stack with more agile methods to prepare and load data, and intuitive ways to visualize and explore that data. Business analysts could create analytics apps for key processes, delivering interactive BI dashboards to everyday users. Eventually even more lightweight data visualization tools came to market, and while BI could now reach between 25-50% of employees, most of these visualization tools lacked governance. Because these tools focus on content authoring, low data literacy rates limited user adoption and led to the use of untrustworthy data sources.

3rd Generation BI – Democratized

BI is now in its next phase, driven by new approaches to how you manage big data and leverage AI. Trusted data is accessible to all users through governed data catalogs. AI analytics accelerates discoveries and increases data literacy by suggesting insights, automating processes, and providing conversational, natural language interaction. And embedded analytics brings BI to the applications and processes that people and machines interact with daily. These innovations are enabling organizations to reach the 50-75% of employees not yet using BI, offering a huge potential increase in value from data.

FAQs

What are the 4 concepts of business intelligence? 

  1. Data integration involves combining information from various sources to provide a unified view, ensuring that data is consistent and accessible for meaningful analysis in BI.

  2. Data warehousing is the process of centralizing and organizing large volumes of data from diverse sources into a single repository, facilitating efficient retrieval and analysis for BI purposes.

  3. Data mining involves exploring and extracting patterns, trends, and valuable insights from large datasets, enabling organizations to make informed decisions based on hidden or previously unknown information.

  4. Data visualization transforms complex datasets into clear, visual representations like charts and graphs, facilitating easier understanding and interpretation of insights by decision-makers in the business intelligence process.

What is the main role of business intelligence?

The main role of business intelligence (BI) is to empower organizations with data-driven insights for informed decision-making. By collecting, analyzing, and visualizing data, BI facilitates the identification of trends, patterns, and key performance indicators, enabling businesses to respond strategically to market dynamics, optimize operations, and gain a competitive edge.

What is an example of business intelligence?

An example of BI is the use of a dashboard that consolidates sales data from various sources, providing real-time insights into performance metrics, customer behavior, and market trends. This allows decision-makers to quickly assess the health of the business, identify opportunities, and make informed strategic decisions based on a comprehensive understanding of relevant data.

See Modern BI in Action