Business Intelligence (BI) Tools

2022 reviews of top BI software. This guide provides an in-depth comparison of the top BI tools and practical advice to help you select the right solution for your organization.

Business Intelligence tools: Power BI vs Qlik vs Tableau

What Are Business Intelligence (BI) Tools?

Business intelligence tools are software and SaaS applications that inform business decisions by bringing together and processing data from a variety of sources. Modern BI tools support use cases for users of all skill levels such as interactive dashboards, data visualization, augmented analytics, and embedded analytics.

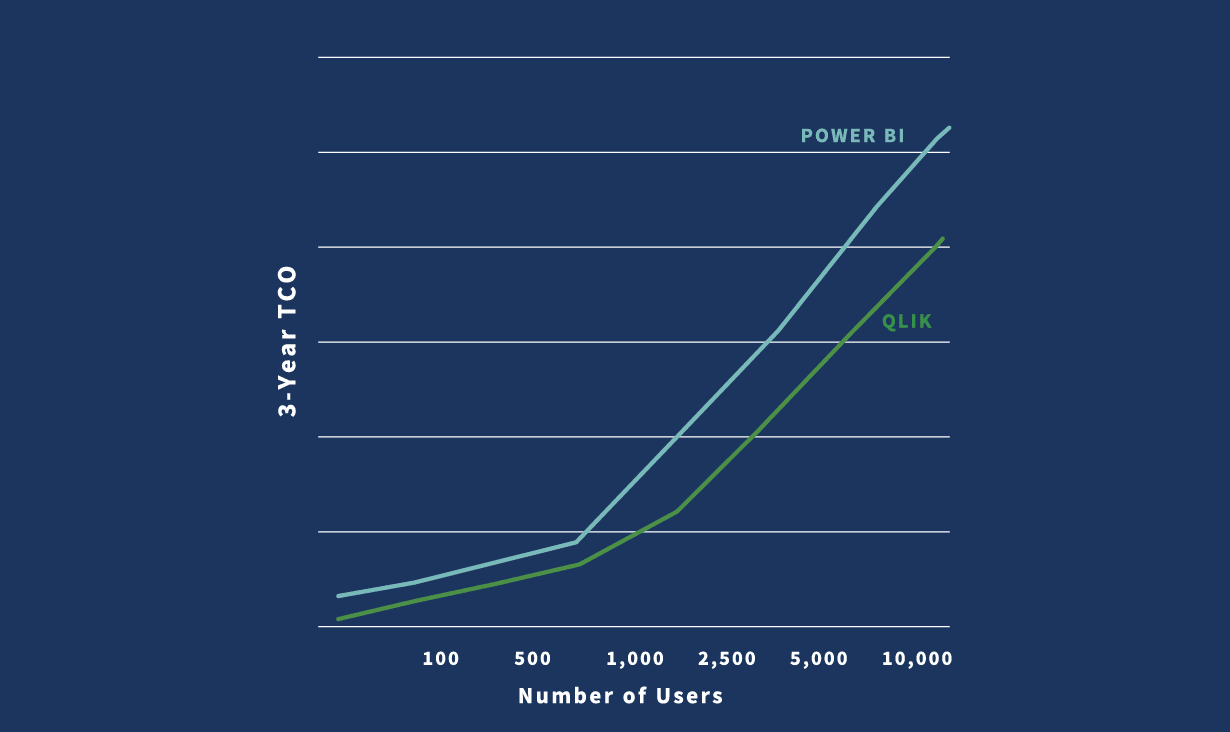
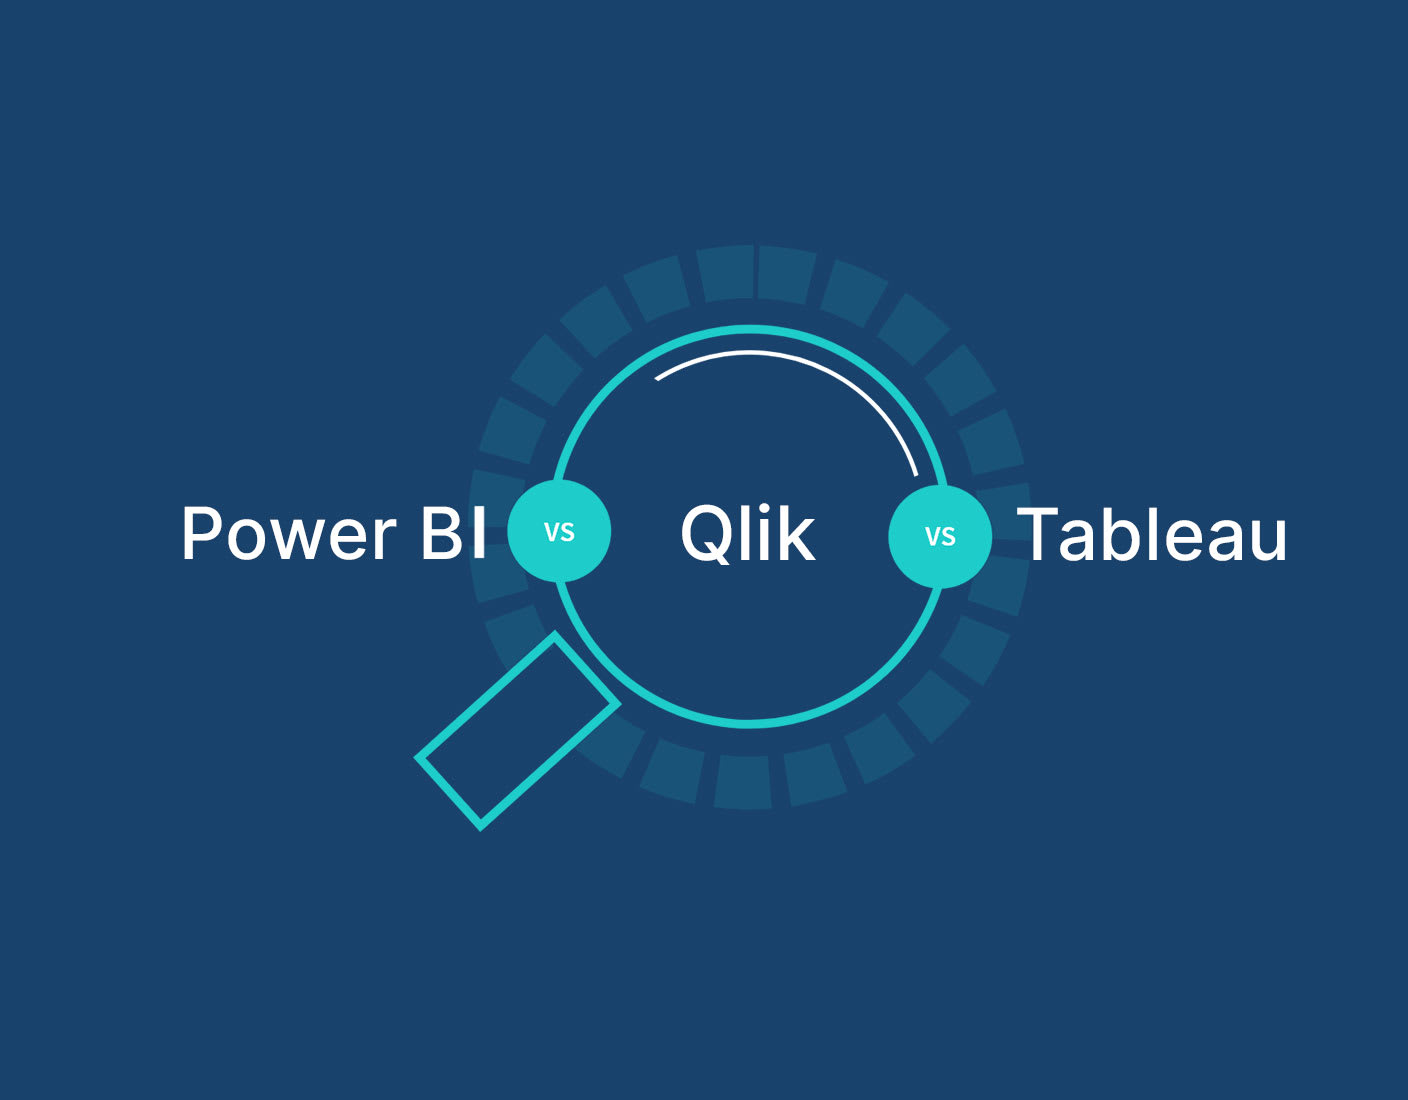
Power BI vs Tableau vs Qlik – The 3 Gartner Leaders

In the 2023 Gartner Magic Quadrant BI report, only three vendors were named as Leaders: Qlik, Power BI and Tableau. Here we take a deep dive in comparing the three Leaders on the most important criteria when evaluating business intelligence software.

Fully Interactive Dashboards

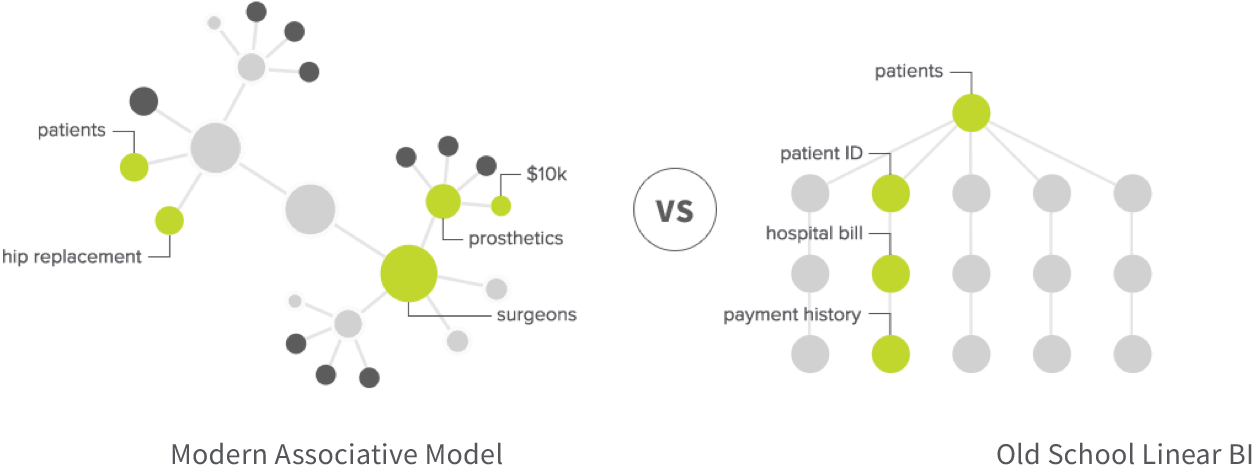
Many BI tools can create pretty dashboards. Your tool should allow end-users to freely explore all your data, in any direction, directly from within the dashboard. This lets you uncover connections you might not have queried or just couldn’t find at all with a query-based BI tool.
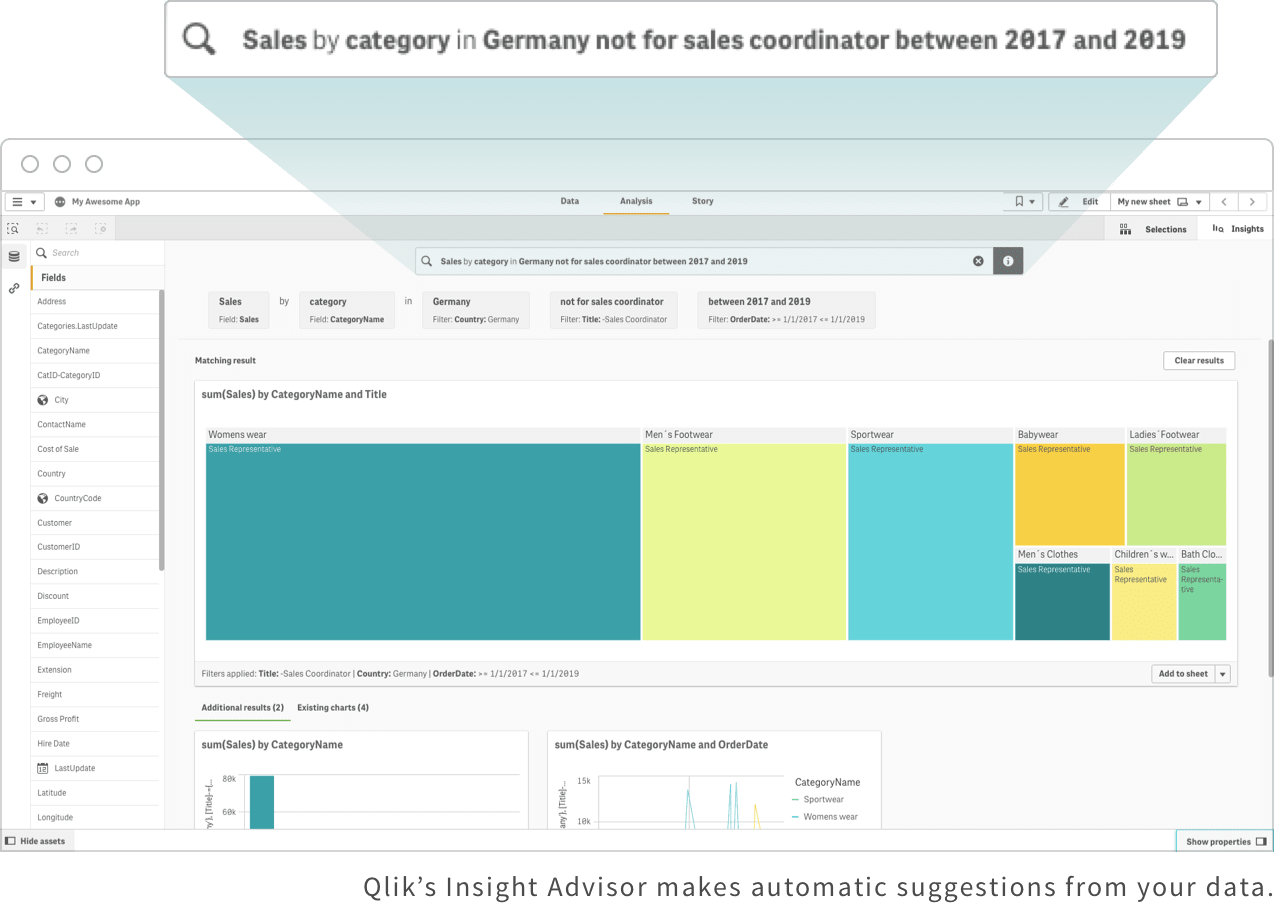
Diagram depicting a modern associative model versus an old school linear BI

Qlik

Power BI

Tableau

Data Visualization

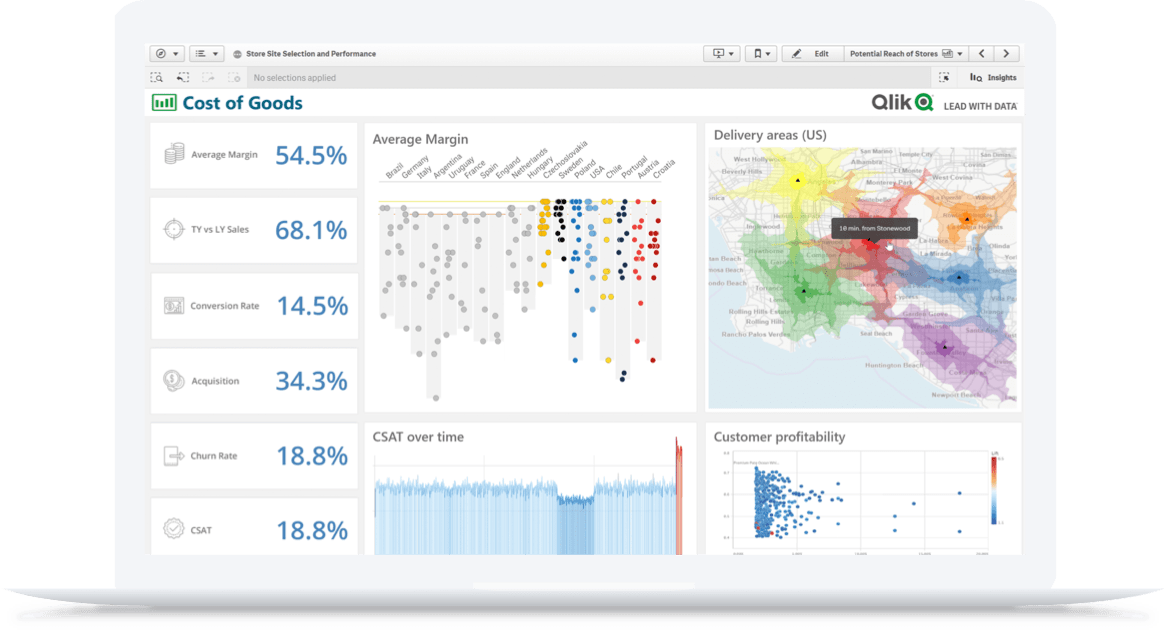
Visualizing data in graphs, charts and maps makes it easier for stakeholders to understand and engage with. The best tools go further by using AI to automatically reveal the shape of your data, pinpoint outliers and even suggest new visuals.

Laptop showing Qlik's interactive dashboards on the monitor

Qlik

Power BI

Tableau

BI Tools Comparison Kit

Essential resources for selecting the best tool for your organization, including an evaluation checklist, a TCO comparison report and analyst findings.

Augmented Analytics

Augmented analytics amplifies the power of human intuition with the scale and speed of machine intelligence, raising the data literacy of every user and increasing efficiency.

Screenshot of a dashboard showing how augmented analytics can make suggestions for your data based on searched terms

Qlik

Power BI

Tableau

Broad Use Cases, One Platform

Business intelligence tools should support many use cases--like exploring data, embedding analytics, or creating interactive dashboards--for many different types of users, such as analysts, engineers and businesspeople. The best BI tools should allow all users to carry out all BI use cases using the same platform and data.

Diagram depicting all use cases versus one use case

Qlik

Power BI

Tableau

Governed self-service

Top BI tools should allow you to keep your data and content under control without limiting self-service discovery. They should have a centralized management capability that uses rules-based governance to control publishing, sharing and user access to apps and data. Because you want data, analytics and insights everyone can trust.

Image showing a woman standing inside a bar chart looking at line graphs above her

Qlik

Power BI

Tableau

Scalability

Uncovering insights works best when users have a complete, up-to-date view of all relevant data. This requires business intelligence tools to integrate and combine data from any source, as close to real-time as possible. To do that successfully, you need BI software that’s built to handle data at any scale without compromising performance or driving up costs.

Bar chart depicting increased users, data scale, and analytic complexity

Qlik

Power BI

Tableau

Mobility

No matter where you are or what device is closest, you need a platform that lets you freely explore data and uncover hidden insights whenever inspiration (or curiosity) strikes.

Image of a laptop and mobile phone showing graphs and charts

Qlik

Power BI

Tableau

Embedded analytics

Building a competitive edge comes from making new discoveries in every area of your business. But that only works if analytics are everywhere, too. The best BI tools should allow you to easily embed robust analytics to the applications, portals and processes your business runs on. This includes your entire enterprise ecosystem – so employees, suppliers, partners and customers alike can make better decisions faster than ever.

A laptop showing a metrics dashboard with callouts highlighting a bar chart and pie graph

Qlik

Power BI

Tableau

Total Cost of Ownership

Many companies only consider the initial purchase price when choosing business intelligence software. But total cost of ownership (TCO) is much more than that. From buying the software and infrastructure, to deployment and integrations, to support and maintenance, some platforms demand a much bigger financial – and time – commitment.

A line graph showing the total cost of ownership between Qlik Sense and Power BI over a 3-year period

Qlik

Power BI

Tableau

Flexible Cloud Strategy

Keep your cloud strategy flexible. Business intelligence tools should help you gain insights, not force you to build new infrastructure or limit your options. From on-premise to cloud hybrid, your BI software should have a platform-agnostic, multi-cloud architecture that enables you to deploy in any environment with unparalleled performance and scalability.

Diagram depicting the flexibility of cloud services, public/private cloud, and on-premises

Qlik

Power BI

Tableau

Data Integration

Your business intelligence software will help you go further faster if it has end-to-end data integration and analytics. This is because a flexible and scalable data integration and analytics solution can put the power of insight into the hands of any user. Bringing these capabilities together as an integrated solution means you can quickly focus on maximizing the value of your data and analytics, not managing a complex technology stack.

Diagram showing how data is processed into the Governed Data Catalog and BI Applications.

Qlik

Power BI

Tableau

Data Literacy

Data literacy is the ability to read, work with, analyze and communicate with data. It’s a skill that empowers all levels of workers to ask the right questions of data and machines, build knowledge, make decisions, and communicate meaning to others.

A group of men and women around a table discussing prints of charts and graphs

Qlik

Power BI

Tableau

5 Key Steps To Evaluate BI Tools

Transforming your business into an insight-driven operation starts with a modern business intelligence tool, and choosing the right tool is critical for success. Not all BI tools are created equal. To make the right choice, organizations must consider how business intelligence will drive value, which users will be doing the driving, and the full spectrum of costs associated with deploying the solution.

Below are five key steps for evaluating and selecting the best BI tools:

  1. Be specific about the ways in which analytics will drive value
    Your best data insights will come once you make concrete decisions about what your organization is trying to achieve digitally. For example, you might be trying to democratize data and analytics by embedding them into operational apps or creating advanced analytics to support strategic decisions. The more specific your requirements, the easier you can frame selection criteria.

  2. Identify which users REALLY are important
    Users may include technical business analysts, data scientists; business users and managers, upper-level management, external clients and partners, customers, and even front-line customer service reps or warehouse personnel. Are they all important? They might be. The point is, be honest, identify which ones are, and then determine if the analytics platform can meet their needs…and use cases.

  3. Go beyond TCO to recognize the costs of doing analytics wrong
    Evaluating TCO is a critical factor in selecting a platform. But, when you select a business intelligence tool as a foundation to drive digital transformation in your organization, there are a multitude of hidden costs to consider. We’re not just talking about the usual hardware, software, support, training, and ongoing license/subscription fees.We’re talking the REAL hidden costs…the ones that many vendors don’t want to discuss, such as “What’s it going to cost if repositories of visualizations are not available for reuse?” or “What’s the cost of purchasing and integrating complementary software when my data and visualizations can’t be packaged and deployed together within applications?” Learn more about the hidden costs of business intelligence software that cannot easily address your use cases.

  4. Focus on business intelligence and analytics capabilities that deliver widespread value
    Who cares if Platform A beats Platform B in 7 out of 10 features tested if the features do not align to the broad spectrum of specific use cases needed across your organization? This guide provides you with in-depth criteria to evaluate virtually any business intelligence use case.

  5. Identify the capabilities needed to drive digital transformation
    Before getting into feature/function discussions, make sure you’re considering business intelligence tools that offer a solid foundation to support data-driven digital transformation. At the core of this foundation is intuitive data access, robust governance, and broad deployment options. An effective BI tools comparison process will help you gauge the ability of any solution to effectively democratize data and drive data literacy throughout your business.

The BI Tool As A Holistic System

Data analytics alone is no longer enough. Modern business intelligence tools must close the gaps between data, insights and actions, to better inform decisions, drive actions, and propel business forward. This means taking a holistic approach, bringing together data integration, data analytics and data literacy.

Diagram showing the offerings of data literacy offered as a service

As shown above, business intelligence software should actually be a holistic system, starting with enterprise data integration to make all data universally accessible to all users. Then, a business-ready data catalog helps all users find this data. Augmented analytics helps users understand the data and embedded analytics helps all users take action on it. Finally, providing data literacy as a service helps all users trust and have the confidence to work with the data.

Let’s take a deeper look at each stage:

  1. Data Integration focuses on improving communication, integration and automation of data loads between business analytics consumers and the data teams. It’s about moving from raw to analytics-ready data in order to advance the speed and accuracy of analytics and improve productivity. By leveraging real-time data integration technologies such as change data capture and streaming data pipelines, the best BI tools change how data is shared and how it is made available across the enterprise.

  2. A data catalog provides actionable data, on-demand. This simplifies and accelerates an organization's ability to manage, prepare and deliver analytics-ready data to every business user across a diverse data landscape. Modern data catalogs optimize existing data assets and then curate, enrich and transform that data into business-ready information which can be made accessible to business users via a simple catalog and marketplace.

  3. Augmented analytics provides better insights, faster. The best BI tools seamlessly integrate with the data offerings mentioned above and enrich the human experience through AI rather than a black box approach. Qlik even offers self-service intelligent alerting and advanced statistical trending and outlier evaluation that immediately notifies users of material changes in the data.

  4. Embedded analytics put actionable analytics and data into the hands of people right where they make decisions. Modern business intelligence tools provide open API’s and an extensible platform.

  5. Data literacy offered as a service goes way beyond education on how to use a product. It strives to create a data-driven culture through a holistic approach that blends training, processes and technology to ensure customer success.

FAQs

How do modern business intelligence tools work?

They make it easier for business users to access, explore, and extract insights from an organization’s information assets by simplifying the process of connecting to, gathering, and profiling data from various business systems and other sources, and streamlining data preparation processes. They help users create data visualizations and rich analytics applications, as well as build and share reports and dashboards which are used to distribute actionable insights across the organization.

How do business intelligence tools support decision-making?

Business intelligence software helps by providing decision-makers with timely, accurate information and actionable insights about a business. This allows them to better understand customer behavior, track performance, detect market trends, discover emerging problems, and obtain greater visibility into all aspects of the business.

See Modern Analytics in Action